The Amridata workflow

From spreadsheet to explanation in one connected workspace.

Amridata is built around a simple idea: upload a tabular file, understand what is inside it, clean what needs attention, visualize the right question, and explain the result without rebuilding context in five different tools.

  • ✓CSV, XLSX + JSON
  • ✓19 chart types
  • ✓AI-assisted explanation
Feature map

Use the feature that matches the next question.

Each capability has a clear job and links back to the same dataset workspace.

Data Analysis

Understand a dataset before you build a dashboard.

Upload CSV, XLSX, or JSON and Amridata profiles the dataset automatically: column types, descriptive statistics, missing values, duplicate rows, unique values, and useful starting points for analysis.

  • ✓Type detection: Identifies likely number, date, category, text, boolean, and ID columns while still allowing a user override when the source is ambiguous.
  • ✓Descriptive statistics: For numeric data, expose values such as minimum, maximum, mean, median, and standard deviation where available.
  • ✓Category profiling: Understand unique-value counts, common values, and whether a text field behaves more like a category than free text.
Explore Data Analysis →
Amridata dataset analysis workspace showing column statistics and data quality information
Data Analysis product visual
Data Visualization

Build useful charts without wrestling with a BI interface.

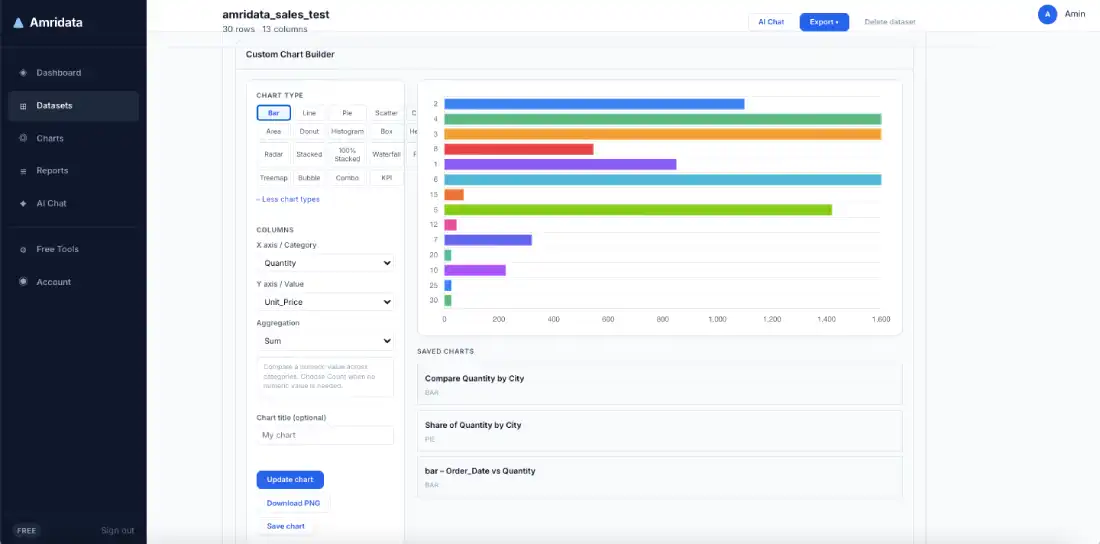
Use recommended charts or a type-aware Custom Chart Builder. Amridata supports 19 chart types, validates the columns each chart needs, and lets users save charts or download supported visuals as PNG.

  • ✓Comparison charts: Bar and column charts for category comparisons, including stacked and 100% stacked variants.
  • ✓Trend charts: Line and area charts for ordered or date-based data, plus combo charts for two numeric measures.
  • ✓Distribution charts: Histograms and box plots help inspect spread, quartiles, and unusual values.
Explore Data Visualization →
Amridata Custom Chart Builder displaying multiple data visualization options and a rendered chart
Data Visualization product visual
Data Cleaning

Fix common spreadsheet problems inside the same analysis workspace.

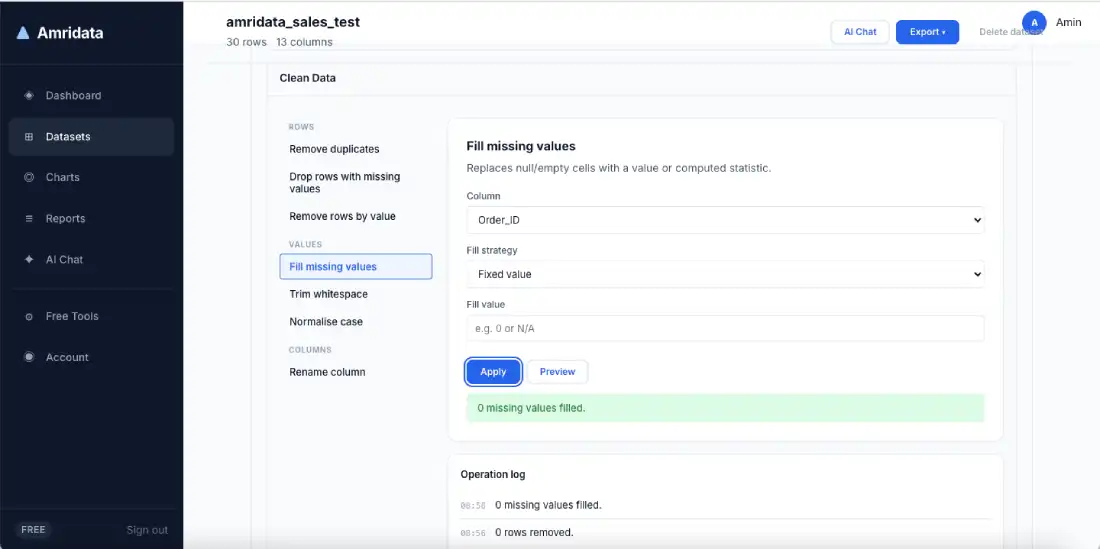
Use targeted cleaning operations to remove duplicate rows, handle missing values, normalize text, rename columns, remove unwanted records, and correct data types before you chart or report.

  • ✓Remove duplicates: Delete exact duplicate records from the imported dataset.
  • ✓Handle missing data: Drop rows with missing values or fill missing values using the available cleaning controls.
  • ✓Trim whitespace: Remove accidental leading or trailing whitespace that creates duplicate-looking categories.
Explore Data Cleaning →
Amridata Clean Data panel showing duplicate removal, missing-value handling, and text cleanup controls
Data Cleaning product visual
AI Data Chat

Turn data questions into a guided conversation.

AI Chat gives Gemini structured context about your dataset—its columns, statistics, quality signals, and a small sample—so you can ask practical questions without writing SQL or formulas.

  • ✓Natural-language questions: Ask about columns, quality, patterns, suitable charts, or what to inspect next.
  • ✓Multi-turn context: The chat keeps a bounded conversation history so follow-up questions can build on recent context without growing indefinitely.
  • ✓Server-side credentials: The Gemini API key remains in server configuration and is not sent to browser JavaScript.
Explore AI Data Chat →
Amridata AI Data Chat conversation panel beside dataset context and suggested analysis actions
AI Data Chat product visual
Auto Insights

Give every dataset a concise analytical briefing.

Auto Insights turns dataset context into a structured summary with data-quality observations, notable patterns, and recommended next steps. Successful insights are cached so ordinary page refreshes do not waste AI requests.

  • ✓Dataset summary: A concise overview of what the dataset appears to contain and what kind of analysis may be useful.
  • ✓Quality observations: Calls attention to issues such as missingness, duplicates, or type concerns based on the dataset context.
  • ✓Pattern descriptions: Highlights plausible trends, relationships, or notable structures that deserve verification.
Explore Auto Insights →
Amridata Auto Insights panel showing dataset summary, quality observations, patterns, and recommendations
Auto Insights product visual
Connected by design

The dataset—not the feature—is the center of the product.

That matters because analysis becomes easier to trust when cleaning, charts, AI context, exports, and reports all refer to the same working dataset.

  1. 01UploadCSV, XLSX, JSON
  2. 02UnderstandTypes, stats, quality
  3. 03CleanExplicit user actions
  4. 04Visualize19 chart types
  5. 05ExplainAI + reports
User control

A useful analysis tool should let users control their own work.

Amridata keeps core actions visible rather than hiding them behind automatic behavior.

  • ✓Delete datasets you own with confirmation.
  • ✓Delete saved charts independently.
  • ✓Rename columns and override detected types.
  • ✓Export dataset copies in supported formats.
  • ✓Refresh AI insights when a new explanation is needed.
Start with real data

See the workflow on a dataset you already understand.