Histogram Maker
Paste numbers to draw a histogram with automatic or custom bins, mean and median lines and summary statistics, then download it as PNG.
Explore practical tools for understanding, calculating, and visualizing data. Start with the tools available today and discover more as the library grows—each tool has its own page, clear purpose, and free access.
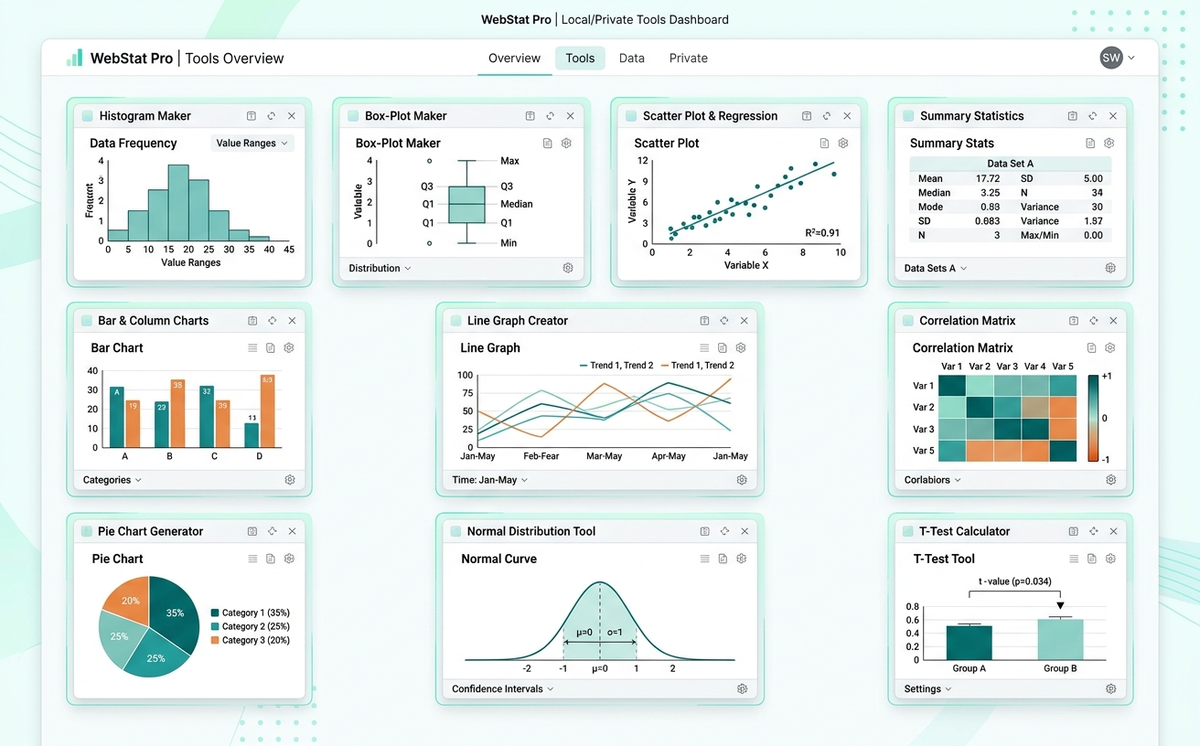
Search by tool name or topic, or select a category to narrow your options. Every tool listed below is available to use for free. The directory updates as new tools are published. Up to 100 tools are displayed per page.
Paste numbers to draw a histogram with automatic or custom bins, mean and median lines and summary statistics, then download it as PNG.
Create box-and-whisker plots from pasted numeric groups, review five-number summaries and IQR outliers, and export the chart as PNG.
Create bar charts from typed values, pasted spreadsheet cells or CSV. Choose vertical, horizontal, grouped or stacked bars and export PNG, SVG o…
Create vertical column charts from typed values, pasted spreadsheet cells or CSV. Choose grouped or stacked columns and download PNG, SVG or CSV.
Build an editable data dictionary from pasted CSV or spreadsheet data. Check inferred types, missing and unique values, then export CSV, JSON or…
Make a line graph from typed values, spreadsheet paste or CSV. Compare up to six series, adjust axes and colors, and download PNG, SVG or CSV.
Paste numbers to get mean, median, mode, standard deviation, variance, quartiles, IQR, standard error, skewness and kurtosis, with potential out…
Find duplicates, missing values, stray spaces and inconsistent text in a CSV file. Preview each fix, undo changes and download a cleaned CSV.
Create a scatter plot from X-Y data pasted from Excel or a CSV. Add a line of best fit with Pearson r and R², then download PNG, SVG or CSV.
Create data heatmaps from spreadsheet cells, CSV or long-list records. Choose sequential or diverging colors and download PNG, SVG or CSV.
Enter paired X and Y values to get Pearson's r or Spearman's rho with a scatter plot, a plain-language reading and, for Pearson, a p-value and c…
Create frequency tables from numbers or text categories with relative, percentage and cumulative frequencies. Group intervals, view a chart and…
Check CSV, TSV or pasted spreadsheet data for empty cells and markers such as NA. See missing counts by column and row, patterns and exportable…
Find outliers with IQR, Z-score, Modified Z-score, Grubbs or Dixon Q. See per-value results, before and after statistics, charts and full workin…
Paste or upload data, drag fields into rows, columns, values and filters, and get a grouped summary. Export CSV, XLSX or Markdown, or chart the…
Paste X-Y data to get the regression equation, R², slope p-value, ANOVA table, residual plot and prediction intervals for new X values.
Lay out fact and dimension tables on a visual canvas, declare grain, label column roles and wire keys. Export DDL for four SQL dialects, JSON or…
Connect source and target columns, tag each transformation and write its SQL rule. Export an INSERT INTO ... SELECT script or a CSV mapping docu…
Turn daily rows, row size and retention into compressed storage and monthly cost estimates for Snowflake, BigQuery, Redshift Serverless and Azur…
Enter analyst hours, decision delays and warehouse costs to get payback in months, 3-year ROI and 5-year NPV across three scenarios, plus a prin…
Paste CREATE TABLE SQL from MySQL, PostgreSQL, Snowflake or BigQuery to draw a crow's foot ER diagram. Export PNG, SVG or Mermaid code.
Enter or paste category totals to draw a pie or donut chart. Percentages are calculated for you and always add up to 100%. Export PNG, SVG or CS…
Run one-sample, two-sample (Welch's or Student's) and paired t-tests from raw data or summary statistics. Get the t-statistic, degrees of freedo…
Find a focused tool without setting up a full analytics project.
Search the directory by the chart, calculation, or data question you want to explore.
Follow the instructions on the tool page. Input types and accepted formats depend on the tool.
Check the result, interpretation, and any available export options before using it in your work.
The Histogram Maker and Box Plot Maker run their calculations in your browser without sending pasted numbers to Amridata for chart generation. As new tools are added, check each tool page for its input requirements, processing details, and available downloads. Do not enter sensitive information unless the tool's privacy explanation supports your use case.
Yes. The tools published in this directory are available to use for free. Individual features and output formats can vary from tool to tool.
No account is needed to use the standalone tools listed here. Amridata's separate dataset workspace has its own account experience.
The current Histogram Maker and Box Plot Maker process pasted numerical data in your browser. For any additional tool, read its own privacy and processing information before entering data.
Some tools, including the Histogram Maker and Box Plot Maker, support PNG chart downloads. Available exports vary by tool and are explained on its page.
Use the search box above to enter a method or topic, such as histogram, probability, or regression. Category filters show the types of tools that are currently available.
Yes. This is a growing directory. Newly published tools are included automatically when they are added to the Amridata tool catalog.