Free Box and Whisker Plot Maker
Make a box plot online from your numbers or a five-number summary. Compare groups side by side, explore quartiles and outliers, and save a chart as PNG—free, with no signup.
- ✓Several groups side by side
- ✓Five-number summary for each group
- ✓1.5 × IQR outlier detection
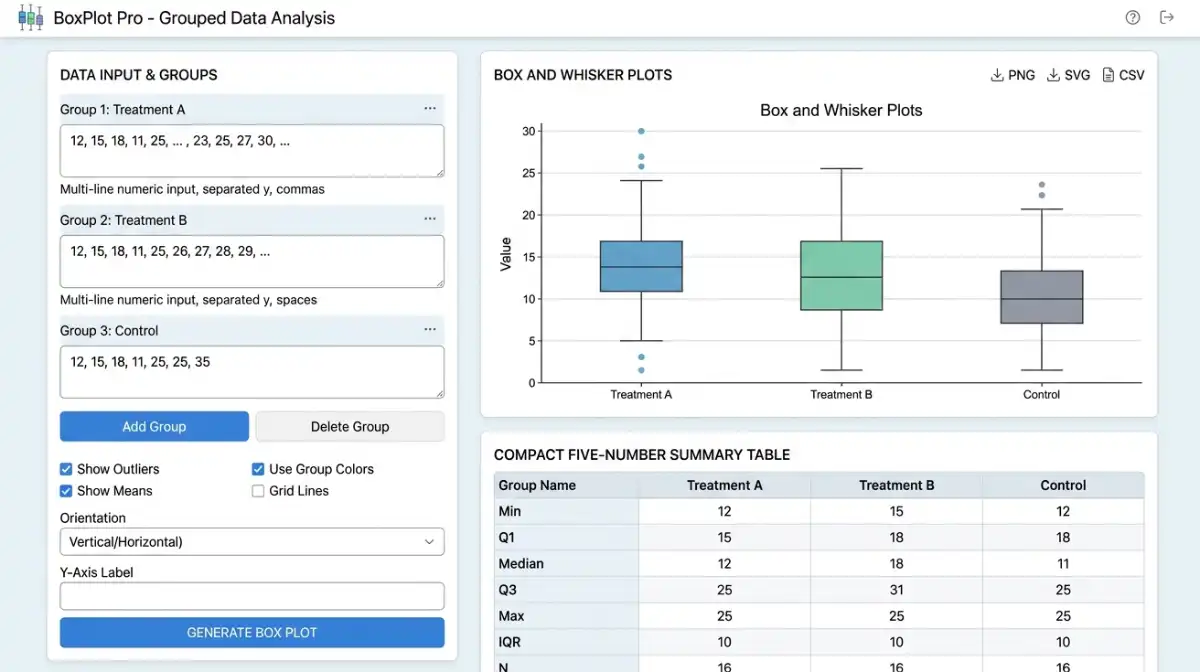
Your box plot will appear here
Paste data on the left and click Generate
↔ Chart contains many groups. Scroll inside the chart to see them all. The page stays in place.
| Group | n | Min | Q1 | Median | Q3 | Max | Mean | SD (sample) | IQR | Outliers |
|---|
Box Plot Graph Maker: Create and Understand Box-and-Whisker Plots
Use the free tool above to draw one or more box-and-whisker plots from numerical data. This guide explains exactly what the boxes, median lines, whiskers and flagged observations mean, with a worked example you can copy into the chart maker.
Key takeaways
The box extends from Q1 to Q3. Its length along the numeric axis is the interquartile range (IQR).
A line inside the box identifies the 50th percentile, not necessarily the arithmetic mean.
With raw data, whiskers reach the most extreme observations within the 1.5 × IQR fences. Summary mode uses the supplied minimum and maximum.
With raw data, dots beyond the whiskers mark potential outliers, not automatic errors.
What Is a Box Plot?
A box plot, also called a box-and-whisker plot, summarizes the center and spread of numerical observations. It is particularly useful for comparing several groups using the same scale, such as exam scores from different classes or delivery times from different services.
The familiar five-number summary contains the observed minimum, first quartile (Q1), median, third quartile (Q3) and observed maximum. This tool displays those five statistics in its results table. In raw-observation mode, the plotted whiskers do not always reach those extremes: if the 1.5 × IQR rule identifies outliers, they stop at the most extreme non-outlier observations. In five-number-summary mode, the whiskers reach the minimum and maximum you enter.
How to Make a Box and Whisker Plot Online
- Choose a format. Select raw observations to calculate statistics automatically, or five-number summary if quartiles are already known.
- Paste your values. In raw mode, enter comma- or space-separated numbers, such as
Class A | 10, 12, 15, 20. - Compare groups. Put each group on its own line; use
|between the label and the numbers. In raw mode, each group needs at least two numbers. - Choose markers. With raw data, show outlier points outside the 1.5 × IQR fences and an optional mean diamond. These markers are unavailable for summary-only input.
- Generate the box plot. Review the chart and table containing the available quartiles, full minimum and maximum, IQR, and—if you entered raw data—sample size, mean, sample SD and outlier count.
- Download the PNG. Save the rendered graphic to include in a report or slide. Add the unit, sample size and source information when you share it.
1200 rather than 1,200 when you mean a single value; commas are separators here. Numeric notation such as -2.5 and 1e3 is supported. The tool rejects invalid entries instead of silently dropping them.Double, Parallel and Side-by-Side Box Plot Maker
To make a double box and whisker plot, enter two named series; for a parallel box plot, add more rows. All boxes share the same numeric axis, making differences in medians, interquartile ranges and outlier patterns easy to compare.
Class B | 10, 13, 14, 17, 19, 23, 35
This also works as a side-by-side box plot maker for several groups; you can enter up to 30 groups and scroll inside the chart when necessary. Boxes are not paired by observation: they summarize each group separately.
Box and Whisker Plot Maker Using a Five-Number Summary
Already know the minimum, Q1, median, Q3 and maximum? Choose Five-number summary above. Enter the five values in ascending order for each group, separated by commas, optionally preceded by a group label and |.
Class B | 8, 14, 17, 21, 28
In this mode, the maker draws the box from Q1 to Q3, the median line, and whiskers to the supplied minimum and maximum. It cannot identify individual outliers or calculate the mean, sample size or standard deviation from the five-number summary alone.
Understanding Every Part of a Box Plot
The lower edge of a vertically oriented box. About one quarter of values are at or below this quartile under the chosen quartile definition.
The line crossing the box. It divides the observations into lower and upper halves by rank.
The upper edge of a vertical box. The interval between Q1 and Q3 spans the middle half of the data.
Whiskers reach the smallest and largest observations inside the fences; observations outside the fences appear as individual dots when enabled.
The mean can be shown as an optional diamond. It may differ from the median when one or more large or small values pull the average away from the middle of the data.
Box Plot Formulas: Quartiles, IQR and Outliers
In raw-data mode, the maker first sorts the values within each group, then finds the quartiles. It uses the linear-interpolation percentile method with zero-based rank position p × (n − 1) for percentile proportion p. Different textbooks and programs sometimes use other quartile conventions, so their Q1 and Q3 results may differ slightly.
The middle 50% of the observations occupy this interval along the value axis.
Upper fence = Q3 + 1.5 × IQR
For raw data, observations strictly beyond these fences are marked as potential outliers. The whiskers terminate at actual observations inside the fences, not necessarily at the fence values themselves.
The mean is the sum of the observations divided by their count. This chart also reports the full sample minimum and maximum, which can differ from the plotted whisker endpoints.
Modified Box Plot Maker With Outliers
A modified box plot uses the 1.5 × IQR fences to distinguish ordinary whisker endpoints from potential outliers. This is the default behavior for raw observations in AmriData. Turning off Show outliers hides the dots only; it does not change quartiles or extend whiskers to include them.
A traditional min-to-max box-and-whisker diagram may instead show whiskers at the overall extremes. The five-number-summary input provides this visual style from supplied endpoints, but it is not an outlier detector because the original observations are unavailable.
Box Plot With Mean and Standard Deviation: What Is Shown?
A box plot's box and whiskers are based on quartiles and spread, not standard deviation. With raw data, this tool can show the arithmetic mean as a diamond and reports the sample standard deviation in the table using √[Σ(x − mean)² / (n − 1)]. The median line and IQR box remain based on quartiles.
Mean and sample SD cannot be recovered from only five summary values. If you need a chart whose error bars explicitly show mean ± SD, use an appropriate error-bar chart instead of treating the box plot whiskers as standard deviations.
Worked Example: Find Quartiles and Outliers
These ten sorted scores include one notably large value. Here is what the Box Plot Maker computes using its interpolation method:
- Median: Average the fifth and sixth observations, 17 and 18, to obtain 17.5.
- First quartile: Rank
0.25 × (10 − 1) = 2.25, between 13 and 15, gives Q1 = 13.5. - Third quartile: Rank
0.75 × 9 = 6.75, between 19 and 20, gives Q3 = 19.75. - IQR and fences:
19.75 − 13.5 = 6.25; lower fence 4.125 and upper fence 29.125. - Interpret: The value 60 is flagged as an outlier. Whiskers run from 10 to 22, while the overall maximum remains 60.
Mean: 20.6. Because the observation of 60 pulls the mean upward, it is higher than the median of 17.5. That does not mean the observation should automatically be removed.
How to Interpret a Box-and-Whisker Plot
Read the numerical axis first, then compare each group's center, middle-half spread, whisker endpoints and flagged points. For a vertical box plot, the height of the box corresponds to IQR; its horizontal width is only a drawing choice and does not encode spread.
- Center: Compare median positions between groups to see which tends to have higher observed values.
- Variability: A longer box along the value axis indicates a larger IQR. In raw-data mode, longer whiskers indicate a larger extent of non-outlier observations beyond the quartiles.
- Asymmetry: Unequal box halves or whisker lengths can suggest asymmetry; they do not prove a distribution's overall shape.
- Flagged points: An outlier might reflect a meaningful rare event, data-entry error or a mix of populations. Investigate before removing it.
- Sample size: A compact summary can hide small-group uncertainty or features such as multiple peaks. Always check group sizes in the table.
Box Plot vs Histogram: Which Should You Use?
| Question | Box plot | Histogram |
|---|---|---|
| Main purpose | Summarize center, IQR and flagged outliers | Show the shape and frequency across numeric intervals |
| Comparing groups | Compact for side-by-side groups | Often needs multiple charts or panels |
| Peaks and gaps | Generally hidden | Often visible, depending on binning |
| Tuning required | Quartile and whisker conventions matter | Bin boundaries and widths matter |
| Best for | Median, middle-half spread, possible outliers | Distribution shape, clusters and gaps |
For a fuller picture, use both: this box plot for a compact summary and the free Histogram Maker to examine the shape of the same values. A similar median and IQR can occur for datasets with noticeably different shapes.
How to Make a Box and Whisker Plot in Excel
In desktop versions of Microsoft Excel that support the statistical chart type, arrange each group's observations in its own column and select the cells. Choose Insert → Insert Statistic Chart → Box and Whisker, then use Format Data Series to adjust mean markers, outlier points or quartile calculation. See Microsoft's box-and-whisker instructions.
If you just need a free online box plot maker rather than an Excel chart, copy a column of numeric cells and paste it into this tool in raw mode. Remember that Excel and AmriData may use different quartile definitions, so some calculated edges can vary.
How to Make a Box Plot in Google Sheets
Google Sheets does not provide the same dedicated box-and-whisker chart workflow as Excel in its standard chart selection. A candlestick chart can approximate the box and whisker shape from prepared values, but it does not automatically reproduce a complete box plot with a median and outlier points.
For a straightforward Google Sheets box plot, copy the numeric cells, paste them into this maker and generate the chart. Or prepare quartile and endpoint columns, then consult Google's candlestick chart guidance if building a custom approximation in Sheets. This tool is separate from Google Sheets, not a Sheets extension.
How to Make a Box Plot in Desmos, TI-84, R, SPSS or GeoGebra
Desmos box plot maker
Enter a list of data and use the boxplot function in the Desmos graphing calculator. Desmos uses a different quartile convention, so numeric results can differ.
TI-84 box plot
Enter observations into L1 using STAT, then open 2nd → STAT PLOT, enable a plot, choose the box plot type and use ZoomStat if needed. See TI's instructions.
Make a box plot in R
For example, run boxplot(c(10, 12, 13, 15, 17, 18, 60)). Base R's boxplot() function can also compare groups.
Make a box plot in SPSS
In Graphs → Chart Builder, choose the boxplot gallery and assign the numeric and optional grouping variables. Read the IBM SPSS boxplot guide.
GeoGebra box plot
GeoGebra supports the BoxPlot command for raw data and for supplied five-number statistics. See the GeoGebra manual.
Using this free online maker
No statistical software installation is required. Paste the observations or five-number summaries, compare groups and export your chart as a PNG.
Why charts may differ across software: Quartile calculation methods, outlier rules and how each program positions its whiskers are not universally identical.
When Is a Box Plot Useful?
Education
Compare class scores or assignment completion times without relying only on class averages.
Business and operations
Compare delivery delays, transaction amounts or support response times among groups.
Research
Summarize measurement variability across treatments, cohorts or experimental conditions.
Quality control
Investigate changes in a process's observed center, spread and flagged measurements.
Common Box Plot Mistakes to Avoid
- Calling the box width the IQR: On this vertical plot, the box's numeric-axis height—not its horizontal width—represents the IQR.
- Assuming whiskers always reach the minimum and maximum: Raw-data mode uses non-outlier whiskers, whereas five-number-summary mode uses the supplied extremes.
- Assuming flagged outliers are invalid: Check their origin and context before deleting or changing observations.
- Treating the median as the mean: The mean marker is optional; it can sit above or below the median line.
- Ignoring quartile methods: Other calculators may use a different percentile convention.
- Claiming normality or significance from a box plot: The picture is exploratory and does not replace formal testing.
- Comparing tiny groups without checking sample sizes: Quartile estimates from a handful of values can be unstable.
- Entering formatted thousands with commas:
1,200will be treated as two numbers here; type1200instead.
For more statistical visualizations, see all free AmriData tools. For further reading, consult the NIST/SEMATECH box-plot reference.
Use it for a focused statistical question.
Use this box-and-whisker graph maker to explore spread, medians and outliers without setting up a full dataset workspace. Select raw values for automatic calculations or provide a five-number summary directly.
Box Plot Maker questions
How the free browser tool behaves.
Does the Box Plot Maker upload my numbers?+
No. Group values are processed in your browser. The signed-in dataset workspace is separate.
How are outliers identified?+
The tool uses the common 1.5 × IQR rule and shows values beyond the whiskers as individual points.
Can I compare more than one group?+
Yes. Enter one group per line in the Label | values format to draw box plots side by side.
Is this a free online box and whisker plot maker?+
Yes. Make box and whisker plots online for free without signing up. Enter raw values or a five-number summary and download a PNG. The free tool processes input in your browser.
Can I make double or side-by-side box plots?+
Yes. Enter two or more named groups, one per line. The maker displays parallel box plots on the same numeric scale; it accepts up to 30 groups.
Does the box plot maker identify outliers?+
For raw data, it flags observations outside Q1 − 1.5 × IQR and Q3 + 1.5 × IQR. Five-number-summary input cannot determine individual outliers, so its whiskers connect the supplied minimum and maximum.
Can I make a box plot using a five-number summary?+
Yes. Choose Five-number summary, then enter minimum, Q1, median, Q3, maximum for each group, in that order. Individual observations, sample size, mean and standard deviation cannot be reconstructed from five numbers.
Does the tool show the mean and standard deviation?+
With raw observations, the tool draws an optional mean marker and reports mean and sample standard deviation in the summary table. Standard deviation is not a box plot whisker or box boundary.
Can I paste values from Excel or Google Sheets?+
Yes. Copy a numeric column and paste it into Raw observations, or use one named group per line. This is not an Excel or Google Sheets add-on; the plot is generated here in your browser.