To calculate standard deviation in Excel, use =STDEV.S(B2:B6) for a sample or =STDEV.P(B2:B6) for the complete population. Both describe spread in the units of your data. The choice depends on what your observations represent, not how many rows you have.
This tutorial is part of our Excel guides. Follow the five-value example below, then use the range, missing-value and troubleshooting checks on your own worksheet.
Quick Answer: What Formula Calculates Standard Deviation in Excel?
Select an empty cell and enter =STDEV.S(A2:A11) if your values are a sample, or =STDEV.P(A2:A11) if they represent the entire population. Press Enter. Excel returns standard deviation in the same units as the original data. The sample function divides the sum of squared deviations by n − 1; the population function divides by N. Replace the example range with your actual observation cells, leaving totals and other summary results outside it.
STDEV.S vs STDEV.P at a Glance
| Function | Use when | Denominator | Example |
|---|---|---|---|
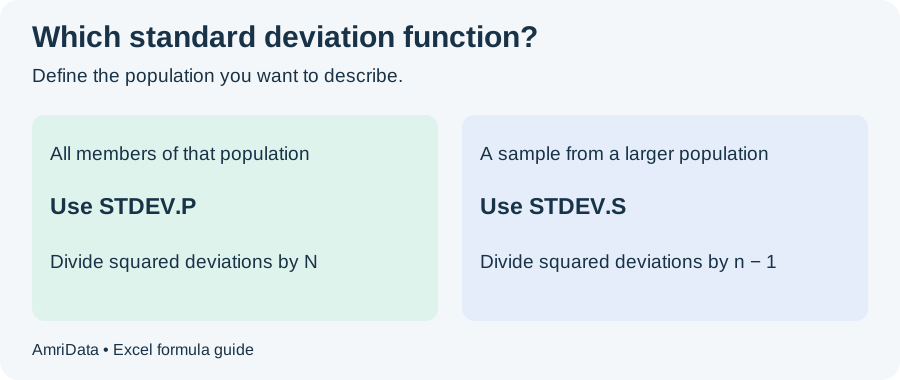
STDEV.S | The observations are a sample | n − 1 | 100 surveyed customers from a customer base of 50,000 |
STDEV.P | The observations are the entire population of interest | N | All 24 employees in one defined department |
A small dataset can be a complete population, and a large dataset can still be a sample. Write down the group you want to describe before choosing. If your question concerns only those 24 employees, the department is the population. If you want to generalize to an industry, the same employees are an observed subset; using a sample formula does not make them representative.
How to Calculate Standard Deviation in Excel in 5 Steps
1. Enter your data
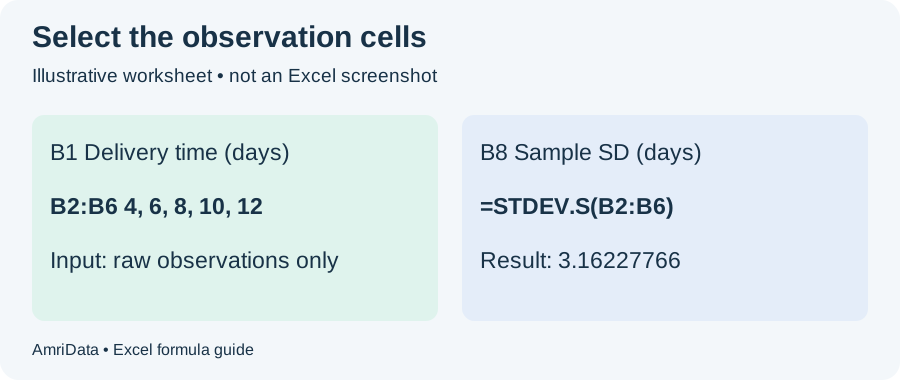
Enter the five teaching values 4, 6, 8, 10 and 12 in B2:B6. Put “Delivery time (days)” in B1. Each number represents one delivery, and all five use the same unit. Keep the observations in separate cells.
2. Decide whether you have a sample or population
For this first calculation, suppose the five deliveries are a sample from an ongoing delivery service. Choose STDEV.S. Later, we will use STDEV.P to describe a population defined as exactly these five deliveries.
3. Select a result cell
Click B8, or another empty cell outside B2:B6. Give the result a clear label in A8, such as “Sample SD (days).” Putting the result inside the input range would overwrite an observation or create a circular reference.
4. Enter the formula
Type =STDEV.S(B2:B6) and press Enter. The colon means every cell from B2 through B6. Check the highlighted range before accepting it. For the population alternative, enter =STDEV.P(B2:B6) in B9.
5. Interpret the result
The sample result is about 3.16 days. It describes spread around the mean of 8 days. Format the output to two decimal places for reading, while keeping the formula and original observations at their available precision.
Worked Example: Sample Standard Deviation
These synthetic delivery times make the arithmetic easy to check. They are teaching data, not measured service performance. Enter the numbers exactly as shown; the first row is a header and the next five rows contain observations.
| Excel row | A: Observation | B: Delivery time (days) |
|---|---|---|
| 2 | 1 | 4 |
| 3 | 2 | 6 |
| 4 | 3 | 8 |
| 5 | 4 | 10 |
| 6 | 5 | 12 |
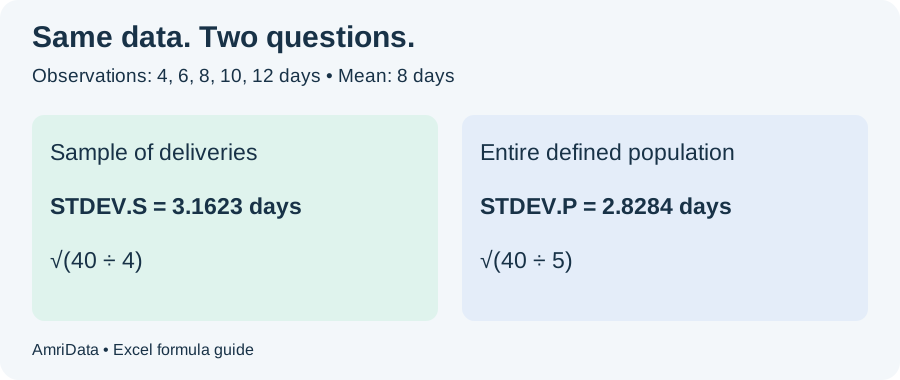
For a sample from a larger delivery process, =STDEV.S(B2:B6) gives approximately 3.16227766 days. The mean is 8 days, the sum of squared deviations is 40, and the sample variance is 40 ÷ 4 = 10 days². Taking the square root gives the sample SD. Report about 3.16 days unless your task requires more precision.
Worked Example: Population Standard Deviation
Now change the question: describe only the complete set of these five deliveries. With that population definition, =STDEV.P(B2:B6) gives approximately 2.82842712 days. The mean and squared deviations stay the same. Dividing 40 by 5 gives population variance of 8 days²; its square root is about 2.83 days.
For the same nonconstant data with at least two values, sample SD is larger by the factor √(n ÷ (n − 1)). Here that factor is √(5 ÷ 4). Neither result is universally “more accurate”: each answers a different question about the data. With identical values, both SDs are zero when the sample calculation has enough observations.
What Does Standard Deviation Mean?
Standard deviation measures how widely numerical observations vary around their mean. It is a measure of spread, not another average or the average absolute distance from the mean. On a comparable scale, a larger SD indicates greater dispersion. There is no universal cutoff that makes an SD good, bad, large or small.
For the mathematical background, see standard deviation explained. This page focuses on choosing and checking the Excel formula. For a broader set of measures, use the descriptive statistics guide.
How Excel Handles Blank Cells, Text and Zero
When STDEV.S or STDEV.P receives an ordinary cell range, numeric cells contribute to the calculation. Blank cells and referenced text or logical values do not become numeric observations. This makes a clean numeric column easier to audit than a long list of manually typed arguments.
| Referenced cell | Practical treatment |
|---|---|
| Numeric 0 | Included as a real observation |
| Genuinely blank cell | Ignored; does not mean zero |
| Text such as N/A | Ignored as text; document why it is there |
| Number stored as text, such as '12 | Ignored until converted to an actual number |
| TRUE or FALSE | Ignored by STDEV.S and STDEV.P in a range |
| Excel error such as #N/A | Investigate and correct its cause before calculating; do not assume safe omission |
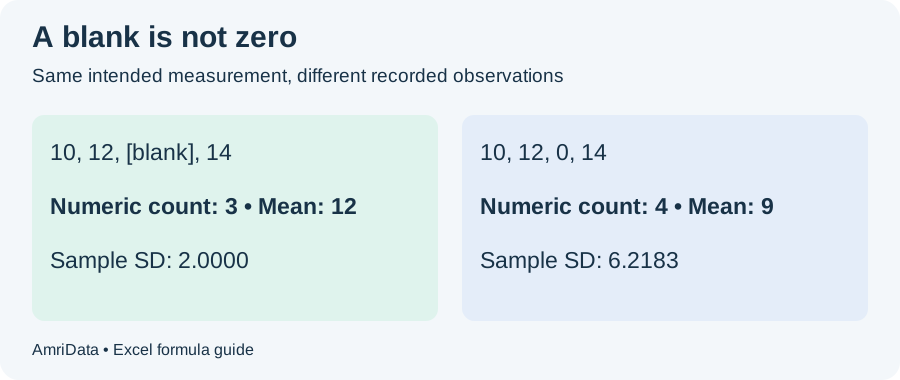
For 10, 12, a blank and 14, the numeric sample is 10, 12, 14: mean 12 and sample SD 2. Replace the blank with numeric zero and the sample becomes 10, 12, 0, 14: mean 9 and sample SD about 6.22. Those results describe different data. Missing delivery time is not evidence of a zero-day delivery.
Direct arguments need separate attention. Logical values and numeric text typed directly into the argument list can be counted: =STDEV.S(10,12,TRUE) uses TRUE as 1, and =STDEV.S(10,12,"14") includes 14. Putting TRUE or text “14” in referenced cells does not have the same effect. Keep raw observations in cells and pass their range.
Literal text N/A is different from the Excel error #N/A. Do not replace either with zero just to obtain an answer. Check failed lookups, missing records and import rules first. The clean data in Excel guide covers preparation before analysis.
Calculate Mean and Standard Deviation Together
| Statistic | Formula for the teaching data | Result |
|---|---|---|
| Numeric count | =COUNT(B2:B6) | 5 |
| Mean | =AVERAGE(B2:B6) | 8 days |
| Sample SD | =STDEV.S(B2:B6) | 3.1623 days |
| Population SD | =STDEV.P(B2:B6) | 2.8284 days |
Use the same intended observations for both the mean and SD. Put the results outside that range and label the unit and sample/population choice. A count next to the results helps reveal numbers stored as text or missing values. COUNT checks numeric cells; COUNTA also counts other nonempty cells, so the two counts answer different questions.
Standard Deviation in an Excel Table or Range
For a list that grows, select the data and choose Insert → Table, confirming whether it has headers. Suppose the table is named SalesData and the numeric column is Revenue. Use =STDEV.S(SalesData[Revenue]) for sampled revenue observations, or =STDEV.P(SalesData[Revenue]) for the full defined population. Use your actual table and column names.
The ordinary column structured reference targets data rows and expands with the table. It excludes the header and table totals row. This is easier to maintain than guessing a future end row. Keep unrelated values outside the table, and remember that a table reference does not itself exclude filtered rows.
A horizontal range also works: =STDEV.S(B2:G2). A named range can be used as =STDEV.S(DeliveryTimes). Separate ranges can be arguments, such as =STDEV.S(B2:B10,D2:D10), when they contain compatible observations of the same quantity. Do not pool age, weight and income simply because their columns sit together.
A whole-column formula such as =STDEV.S(B:B) can include totals, old results or unrelated future numbers. Place it outside column B to avoid including itself, and prefer a bounded range or table for clarity. If the last observation is B6, a formula ending at B5 silently omits it.
Standard Deviation for Filtered or Conditional Data
Ordinary STDEV.S and STDEV.P range formulas include numeric values in hidden and filtered-out rows. Changing the visible worksheet does not automatically change their input. Decide whether you want the whole dataset, the visible rows or a named subgroup.
Visible rows in a filtered column
For a vertical data range, =SUBTOTAL(107,B2:B100) calculates sample SD while excluding filtered-out and manually hidden rows. Use =SUBTOTAL(108,B2:B100) for population SD. Codes 7 and 8 exclude filtered-out rows but retain manually hidden rows. Keep ordinary totals outside the selected range; this method is intended for vertical lists.
A subgroup selected with FILTER
In Microsoft 365, Excel 2021 and Excel 2024, FILTER can select observations by criteria. With region labels in A2:A100 and clean numeric measurements in B2:B100, use =STDEV.S(FILTER(B2:B100,A2:A100="North")). It selects the North group by label, independently of whether rows are visible. Replace STDEV.S with STDEV.P only when that group is the complete population of interest.
If the measurement column can contain blanks or text, restrict the selection to numeric observations: =STDEV.S(FILTER(B2:B100,(A2:A100="North")*ISNUMBER(B2:B100))). This prevents blank measurements from being carried through FILTER as zero. Resolve errors in the criteria column first. No matching numeric observations produces an empty-result error; fewer than two numeric observations cannot support sample SD. Do not use zero as the fallback.
Excel 2016 and 2019 do not provide this dynamic-array FILTER workflow. Use the visible-row SUBTOTAL method or copy the intended observations into a separate, documented helper range. Excel has no standard STDEVIF function analogous to AVERAGEIF. Always record which group and how many observations were included.
Standard Deviation With the Data Analysis ToolPak
The desktop Analysis ToolPak is useful when you need several summaries at once. Enable it in Excel’s add-ins settings if Data Analysis is missing. On Windows, use File → Options → Add-ins, select Excel Add-ins and Go, then enable Analysis ToolPak. On Mac, use Tools → Excel Add-ins. The desktop add-in workflow differs from Excel for the web.
Choose Data → Data Analysis → Descriptive Statistics. Set the input range, group by Columns for this example, and select Labels in first row only if the header is included. Choose an empty output location and Summary statistics, then run the analysis. Compare the reported standard deviation with STDEV.S on the same observations. Rerun the report when the input changes; treat it as an output snapshot. See Excel data analysis for the broader workflow.
Calculate Standard Deviation Manually in Excel
Use this calculation to understand or check the result, rather than replacing the built-in functions in everyday work. For B2:B6, enter =AVERAGE(B2:B6) in E2. In C2, enter =B2-$E$2 and fill down to C6. In D2, enter =C2^2 and fill down to D6. The dollar signs keep the mean reference fixed.
| Value | Deviation from 8 | Squared deviation |
|---|---|---|
| 4 | −4 | 16 |
| 6 | −2 | 4 |
| 8 | 0 | 0 |
| 10 | 2 | 4 |
| 12 | 4 | 16 |
The sum =SUM(D2:D6) is 40. Sample SD is =SQRT(SUM(D2:D6)/(COUNT(B2:B6)-1)), or √10 ≈ 3.1623. Population SD is =SQRT(SUM(D2:D6)/COUNT(B2:B6)), or √8 ≈ 2.8284. This helper-column demonstration assumes every input cell contains one valid number.
In symbols, sample SD is s = √[Σ(xᵢ − x̄)² / (n − 1)], where xᵢ is an observation, x̄ is the sample mean and n is the count. Population SD is σ = √[Σ(xᵢ − μ)² / N], where μ and N are the population mean and size. Squaring removes negative signs; the final square root restores the original measurement units.
STDEV.S, STDEV.P, STDEVA and Legacy Functions
| Function | Role | When to consider it |
|---|---|---|
| STDEV.S | Sample, numeric observations | Default for a sample |
| STDEV.P | Population, numeric observations | Default for a complete population |
| STDEVA | Sample with logical/text evaluation rules | Only when that coding is intended |
| STDEVPA | Population with logical/text evaluation rules | Only when that coding is intended |
| STDEV / STDEVP | Older sample/population names | Maintaining compatibility in older workbooks |
STDEVA and STDEVPA can give logical and text entries numeric roles, including TRUE as 1 and FALSE as 0. Their text handling depends on the argument form. They are not fixes for imported numbers stored as text or unexplained missing values. Convert legitimate numeric observations explicitly and document any intentional coding before selecting these functions. Prefer STDEV.S and STDEV.P in new formulas; retain legacy names only when workbook compatibility requires them.
Common Excel Standard Deviation Errors
| Problem | What to check | Correction |
|---|---|---|
| #DIV/0! | Too few numeric observations; sample SD needs at least two | Check COUNT and convert legitimate numeric text |
| #NAME? | Misspelling, unsupported function or unrecognized name | Check STDEV.S spelling, version and table names |
| #VALUE! or #N/A | Invalid arguments or upstream data errors | Inspect source cells and repair the cause |
| #CALC! with FILTER | No matching observations with no empty fallback | Check criteria and report insufficient data |
| Unexpectedly large SD | Total included, zero substituted, wrong units or genuine extremes | Audit the range and investigate values |
| Formula displayed as text | Text cell format or leading apostrophe | Set an appropriate format, remove the apostrophe and re-enter |
| Circular reference | Result lies inside its own input range | Move the formula outside the range |
Formatting a text value as Number does not necessarily convert its stored type. Use Excel’s Convert to Number action where offered, or a deliberate conversion suited to the import. Check decimal and thousands separators before converting. Left alignment is only a clue because alignment can be customized; ISNUMBER on a suspect cell is a better check.
Formula examples here use English function names and commas between arguments. Your locale may use translated names or semicolons. An input dialog rejecting a formula may therefore be a syntax or locale issue rather than a statistical issue. If a result fails to update, also check workbook calculation settings before trusting an old value.
Avoid =IFERROR(STDEV.S(B2:B100),0) as a general repair. Zero says the included observations have no spread; it does not mean “not enough data.” A clear insufficient-data label is more honest. Keep error handling separate from the decision about which observations are valid.
How to Interpret Standard Deviation in Excel
For the sample example, write: “The five observed delivery times have a mean of 8 days and a sample standard deviation of about 3.16 days.” This reports the center, spread, unit and basis of calculation without asserting that most deliveries fall within one SD. Whether that spread is acceptable depends on the delivery promise and business context.
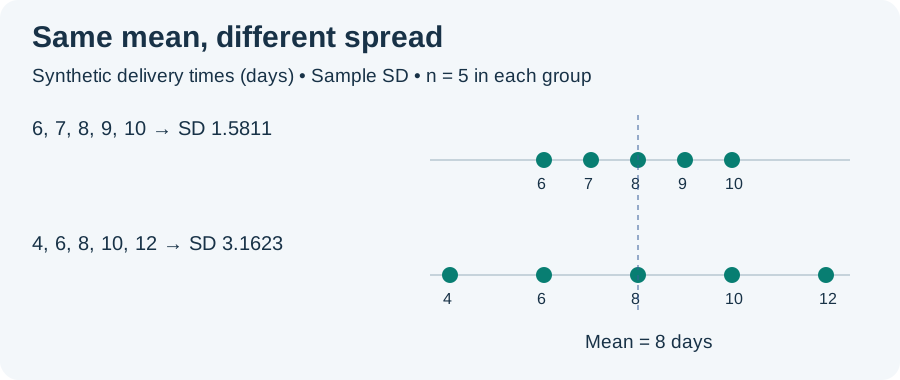
SD alone cannot establish a normal distribution. The 68–95–99.7 rule concerns approximately normal distributions and should not be applied automatically to a spreadsheet. Inspect shape with the Histogram Maker. Use the Box Plot Maker to investigate unusual values. A flagged observation is not automatically an error.
Compare groups only when their measurements use compatible units and meaningful scales. If North has SD 5 days and South has SD 10 days, South’s observed delivery times have greater dispersion by this measure. That comparison does not establish statistical significance or explain the cause. Record each group’s count, time period and inclusion rules alongside the result.
Percentages, currency and time
For percentage-formatted observations, Excel calculates on the stored decimal values. An SD of 0.02 corresponds to 2 percentage points; it is not automatically 2% relative variation. Currency measurements produce SD in that currency. Excel dates are serial numbers and times are fractions of a day, so prefer meaningful durations and convert the output to the intended unit. Multiply a day-based SD by 24 to express hours.
Keep the original precision and round the displayed output to suit the measurement. Standard number formatting changes the display rather than the underlying value. Do not enable “precision as displayed” for this purpose. Rounding each input before calculation can change the result, especially when the spread is small.
Standard Deviation vs Variance and Standard Error
| Measure | Sample formula | Population formula | Unit |
|---|---|---|---|
| SD | =STDEV.S(B2:B6) | =STDEV.P(B2:B6) | Days |
| Variance | =VAR.S(B2:B6) | =VAR.P(B2:B6) | Days squared |
Variance is SD squared. In the example, sample variance is 10 days² and population variance is 8 days². Range is another spread measure: maximum minus minimum, here 8 days. It uses only the endpoints, whereas SD depends on all observations.
Standard error describes uncertainty in an estimated statistic, rather than spread among individual observations. For independent, identically distributed observations with finite variance, estimated standard error of the mean is sample SD divided by √n. Do not label that number SD. See how to read summary statistics for interpretation across a full report.
Common Mistakes to Avoid
| Mistake | Why it misleads | Correction |
|---|---|---|
| Choose by dataset size | Size does not define the population | Write down the population of interest |
| Include a total | The total becomes a false observation | Select raw observation cells only |
| Replace missing with zero | It changes both count and spread | Preserve missingness and investigate |
| Remove every repeated value | Separate observations can legitimately be equal | Remove only accidental duplicate records |
| Combine different variables | Mixed units have no useful common SD | Calculate each variable separately |
| Call a high SD bad | Acceptable variation depends on context | Compare against the purpose and measurement scale |
Calculate Standard Deviation With AmriData
If you do not have Excel open, use the calculator alongside this guide to inspect your values. Keep the sample/population choice consistent when comparing results, and check that both calculations include the same observations.
Open the Descriptive Statistics CalculatorFrequently Asked Questions
What is the standard deviation formula in Excel?
Use =STDEV.S(range) for a sample and =STDEV.P(range) for a complete population. Replace range with your observation cells, such as B2:B6.
What do the S and P mean?
S identifies the sample function; P identifies the population function. Decide which applies by defining the population your question concerns.
Does Excel ignore blanks and include zero?
In a referenced range, genuinely blank cells are ignored and numeric zero is included. A missing measurement and a measured zero describe different situations.
Why is STDEV.S larger than STDEV.P?
For the same nonconstant data, STDEV.S uses n − 1 in the variance calculation, producing a larger SD than division by n. Identical observations give zero for both when sample size is sufficient.
Can standard deviation be zero or negative?
It can be zero when all included observations are identical. It cannot be negative. Sample SD still needs at least two numeric observations; a one-value population has zero spread.
Can I use STDEV instead of STDEV.S?
STDEV is the older sample function retained for compatibility. Prefer STDEV.S in new work. The population counterpart STDEVP is similarly superseded by STDEV.P.
How do I calculate standard deviation with conditions?
In supported dynamic-array Excel versions, select the subgroup with FILTER and pass the resulting numeric observations to STDEV.S or STDEV.P. Check for empty groups and insufficient observations.
How many decimal places should I show?
Use enough to suit the measurement and comparison. Two decimals give 3.16 days in this example. Preserve the original observations and formula precision, even when the display is shorter.
Key Takeaways
- Calculate standard deviation in Excel with STDEV.S for a sample or STDEV.P for a complete population.
- Reference raw observations, excluding totals and existing summaries.
- Check numeric count, missing values and stored data types before interpreting the answer.
- Use a deliberate visible-row or subgroup method when filtering matters.
- Report SD with the mean, count, units and sample/population choice.
Related Excel and Statistics Guides
Microsoft Function References
- Microsoft: STDEV.S
- Microsoft: STDEV.P
- Microsoft: FILTER
- Microsoft: SUBTOTAL
- Microsoft: STDEVA
- Microsoft: STDEVPA