
AI for data analysis means using artificial intelligence to help inspect, clean, summarize, visualize, model, or explain data. An AI assistant can turn a question into a chart, a calculation, or a piece of Python or SQL. But the useful result is not the most confident-sounding answer. It is the answer you can trace to the data, definitions, and a suitable method.
Imagine handing an assistant a sales spreadsheet and asking, “Why did sales fall?” It might quickly point to a lower average order value. Before repeating that conclusion, you would still need to ask: Were refunds deducted? Is each row an order or an order line? Did the number of customers change? AI can make that investigation faster; it cannot supply missing business context by guessing.
This guide shows the practical workflow, compares current tool options, gives reusable prompts, and demonstrates a small analysis you can independently check. It is part of the AI & Data category. For the underlying analytical foundations, start with what data analysis is.
Tool comparison CSV & Excel Prompts Worked example Verification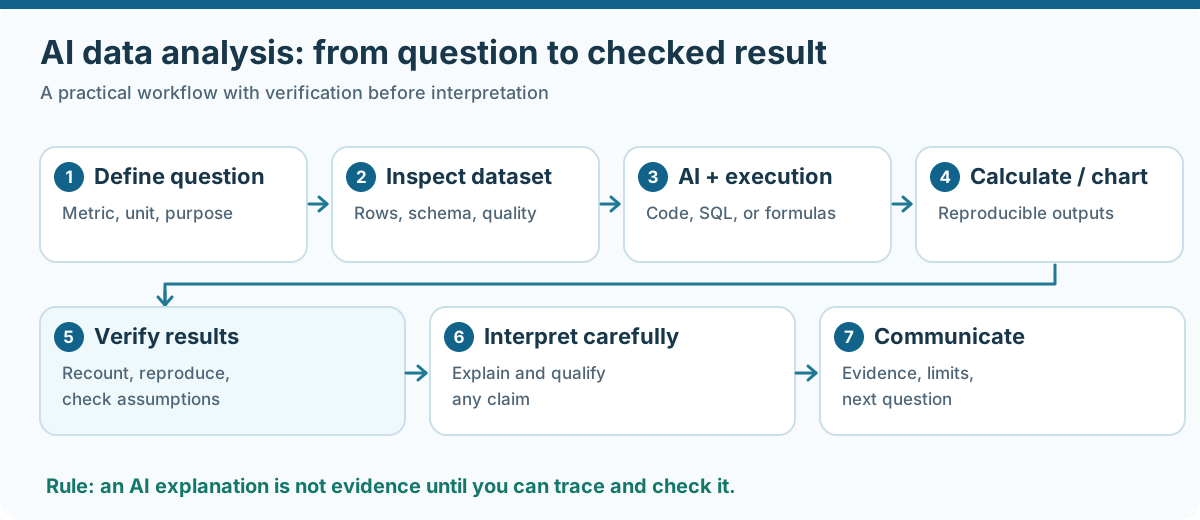
Working rule: ask → inspect → calculate → verify → interpret. Do not upload a file and treat the first AI response as established fact.
How Can AI Be Used for Data Analysis?
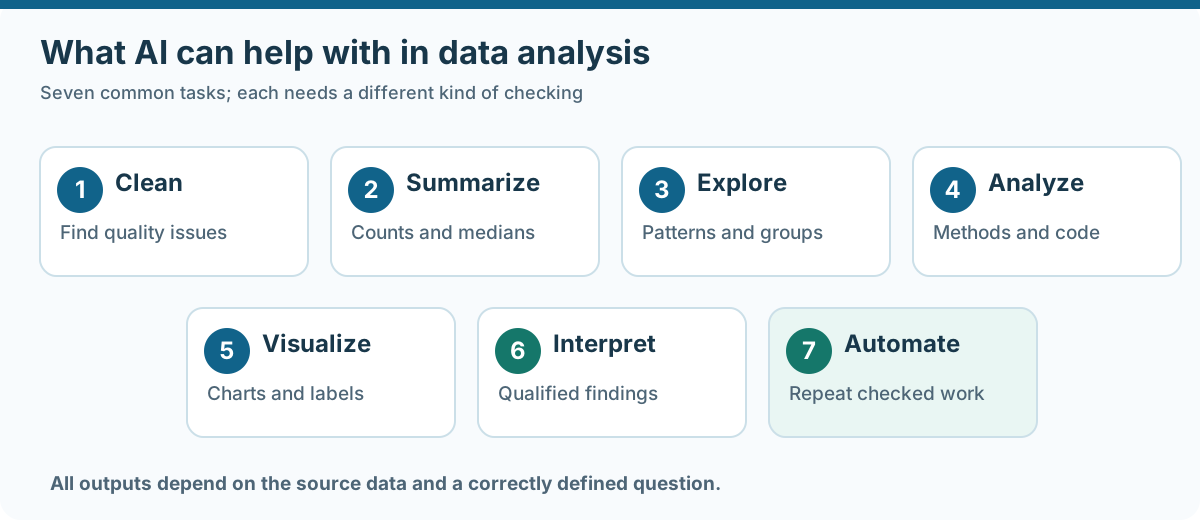
AI can assist data analysis by profiling columns, identifying missing or inconsistent records, drafting cleaning rules, calculating summaries, proposing statistical approaches, creating charts, generating Python or SQL, and explaining findings. Some tools run actual calculations; others mainly produce text from limited context. The difference matters. For numerical decisions, prefer a traceable computation and check the denominator, grouping, missing values, and assumptions before accepting the explanation.
| Your task | AI can help | What you should verify |
|---|---|---|
| Understand a file | Describe fields, types and likely meanings | Row grain, definitions and units |
| Clean records | Flag duplicates, blanks and inconsistent dates | Whether the fix changes valid observations |
| Explore data | Produce summaries and useful follow-up questions | Filters, missingness and subgroup sizes |
| Analyze | Write/run code for comparisons or models | Method, assumptions and calculations |
| Visualize | Choose or build a chart | Axes, aggregation and labels |
| Report and automate | Draft commentary or repeat a pipeline | Freshness, reproducibility and approvals |
What Is AI for Data Analysis?
It is the use of AI-enabled software to help people work with evidence. The underlying tasks are familiar: inspect data, prepare it, calculate something appropriate, and make a defensible interpretation. What changes is how you ask the software to perform those tasks. Instead of manually writing every formula or script, you may describe your question in everyday language and ask for code, a chart, or a report.
That is not the same as a new statistical method. Correlation, regression, cross-tabulation, forecasting, and thematic analysis retain their own assumptions and standards. AI is a tool or interface that may assist with them. Read the separate guide on choosing a data analysis method when your question requires formal analysis.
What AI changes—and what stays the same
| Traditional workflow | AI-assisted option | Unchanged responsibility |
|---|---|---|
| Write formulas and scripts | Describe a task and inspect generated code | Test the code on known cases |
| Profile columns manually | Ask for a data-quality audit | Understand the meaning of each field |
| Build charts step by step | Ask AI to propose or create one | Confirm the correct measurement and scale |
| Draft findings from outputs | Ask for a readable summary | Ensure each claim follows from evidence |
How AI Data Analysis Works
There are several technical routes behind a similar chat interface. In a code-enabled tool, the model may translate “median sale by channel” into a pandas operation, execute that code, and explain the result. In a spreadsheet assistant, the calculation may be handled by workbook formulas or a built-in analytical engine. A dataset-aware product may supply computed statistics, quality signals, and selected rows as context for a model's narrative.
The last approach is especially important to understand. An AI seeing metadata and a sample has not necessarily inspected every original row. It can explain the statistics it receives, but should not claim exhaustive analysis of fields that were never computed. AmriData AI Data Chat describes a dataset-aware workflow; check its computed statistics and charts for any consequential finding.
- Input: a CSV, spreadsheet, database result, transcript, or documented sample.
- Context: column definitions, units, one-row meaning, date range, target question, and business rules.
- Execution: validated code, formulas, queries, chart operations, or retrieval of source passages.
- Review: rerun checks, inspect evidence, and correct a mistaken premise.
- Communication: state what was found, for whom or what period, and what remains uncertain.
What Can AI Do With Data?
Understand an unfamiliar dataset
Start by asking for a table of column names, observed data types, non-null counts, example values, and possible ambiguities. Tell the assistant the unit of analysis: one row per person, order, order item, or survey response. If it guesses that net_amount means pre-tax sales, correct the definition before continuing. Use the Data Dictionary Generator to document meanings, units, allowed categories, and ownership.
Find data-quality problems
AI can propose checks for duplicate IDs, invalid dates, impossible quantities, blank records, unit mismatches, and categories spelled several ways. Ask it to show how many records each issue affects and propose—not silently apply—corrections. A missing refund amount is not automatically zero, and an unusually expensive order is not automatically an error. AmriData's data-cleaning feature and the practical guide to cleaning data in Excel cover complementary workflows.
Speed up exploratory data analysis
Ask for distributions, percentiles, group counts, missingness by subgroup, and plots of relationships. When a scatter plot looks nonlinear, ask for a closer look before jumping to correlation. When one group appears better, inspect its sample size and how missing responses were handled. The full sequence lives in the exploratory data analysis steps guide.
Assist with statistical methods
A tool with computation can calculate descriptive statistics, fit a regression, or help implement an inferential test. It can also produce an inappropriate test if it does not know observations are paired, survey-weighted, repeated, or non-independent. Before accepting a p-value or interval, make it state the outcome, sample unit, method, assumptions, excluded rows, and effect size. Statistical significance is not the same as practical importance.
Identify patterns and anomalies
AI can flag a sudden spike, a distribution shift, or an unusually large transaction for investigation. A flagged point is a lead, not proof of fraud, error, or causation. Confirm it in the source record. For numerical spread, a box plot and a histogram often reveal more than a dramatic written summary.
Help with prediction and forecasting
A coding assistant can create a baseline forecast, fit a model, and propose error metrics. For time-ordered data, train using earlier periods and evaluate on later periods; a random split can leak future information into the test. Compare any advanced approach with a simple seasonal or last-period baseline. A close historical fit by itself does not prove future usefulness.
Explain results and draft reports
After checking calculations, AI is often useful for translating output into ordinary language: “Median order value fell while the number of orders rose.” It can suggest headings, executive summaries, and limitations. Ask it to separate observed facts, plausible explanations, and actions that need further evidence. If a chart shows an association, do not let the narrative silently turn it into a causal claim.
Write Python and SQL
AI can draft pandas grouping, NumPy calculations, Matplotlib charts, SciPy tests, or SQL queries with GROUP BY, joins, and window functions. Request readable code with comments, sample tests, and expected output columns. Review joins for multiplication of rows; use read-only SQL access and never execute destructive commands from generated text without an independent review.
Best AI Tools for Data Analysis: Which Fits Your Task?
There is no defensible universal winner. A good AI tool for data analysis depends on where the data lives, whether exact computation is available, the skills of the person using it, privacy controls, budget, and the need to reproduce the work. The comparison below describes product capabilities from official documentation reviewed October 19, 2026. It is not a hands-on accuracy ranking; the products were not benchmarked against the same test dataset for this article.
| Tool | Useful for | Strength | Check before choosing |
|---|---|---|---|
| ChatGPT | Conversational analysis of uploaded data | Tables, charts and code-backed calculations where available | File/context limits, generated code and methodology |
| Gemini | Google-connected and uploaded files | File questions and AI support in Google Sheets | Workspace entitlement, limits and which source it actually read |
| Copilot in Excel | Working inside Microsoft Excel | Workbook analysis, charts, formulas and PivotTables | License, supported workbook structure and edits |
| Claude | Document-heavy and code-assisted work | File handling, Python-based analysis and output creation where enabled | Plan, enabled tools and source verification |
| Julius | No-code analysis-focused workspace | Data exploration, charts and connected-data options | Credits, plan-level connectors and retention settings |
| AmriData | Dataset profiling, visual checks and explanation | Charts, statistics, quality signals and dataset-aware AI chat | AI chat uses structured context, not necessarily every raw row |
ChatGPT: flexible, code-backed analysis
ChatGPT can accept structured files, answer questions, make tables and charts, and, in suitable environments, run calculations with code. That makes it useful for a marketer examining campaign exports and an analyst iterating on a Python workflow. Ask for the generated calculations and inspect the columns used. A well-written explanation does not confirm that the selected statistical procedure was appropriate. Official ChatGPT data-analysis documentation.
Gemini: Google files and Sheets workflows
Gemini Apps can analyze uploaded spreadsheets and other documents. Google also documents Gemini-assisted tasks within Sheets, including spreadsheet generation and visual support. Confirm whether you are using Gemini Apps or the Sheets integration: availability, limits, and behavior may differ. Gemini file-analysis help and Gemini in Sheets.
Microsoft Copilot in Excel: workbook-native help
Copilot in Excel can help produce and modify formulas, create charts or PivotTables, and answer questions about structured workbook data. Some supported experiences use Python-backed analysis. Its usefulness is greatest when your actual work lives in Excel rather than exported snapshots. Licenses, app versions, and workbook shape matter. For the non-AI workflow, see Excel data analysis. Microsoft's Copilot in Excel FAQ.
Claude: files, analysis and written interpretation
Claude's documented file-creation and execution features can support spreadsheet tasks, Python scripts, and charts in enabled environments. For work with interviews, research notes, and reports, require traceable quotations and check all calculations rather than trusting a fluent synthesis. Claude file-analysis documentation.
Julius: a dedicated analysis-focused workspace
Julius offers data analysis, charts, reports, and data connectors; its free offering uses limited credits, and paid capabilities differ by plan. Check the current credits, connection permissions, and export options before building a recurring workflow around it. Official Julius plans and features.
AmriData: structured statistics plus AI context
AmriData helps users import files, inspect descriptive statistics, visualize data, review quality signals, and ask questions through AI Data Chat. Its documented AI experience uses dataset context such as computed statistics, metadata, and a data sample. This is useful for guided interpretation, but it is not a promise that a language model reprocessed an unlimited dataset row by row. Explore Auto Insights for automatically surfaced patterns, then inspect the underlying chart or table.
Comparison method: these are capability descriptions sourced from product documentation, not performance test results. No 1–10 score or accuracy percentage is assigned. Product functionality, pricing, and availability can change without notice.
Free AI Tools for Data Analysis: What “Free” Includes
For a small public or invented dataset, you can often begin without a paid subscription. That does not mean every tool offers unlimited file analysis, code execution, long-running tasks, connectors, or business privacy controls on its free plan. These offerings were checked from vendor pages on October 19, 2026; review the plan page before sign-up.
| Option | Free starting point | Important qualification |
|---|---|---|
| ChatGPT | Free tier supports file uploads | Usage and model-specific limits apply; not all capabilities are identical |
| Gemini Apps | File questions available to signed-in users | Rolling usage, file and account restrictions apply |
| Julius | Free plan with daily credits | More analysis, integrations or capacity may require upgrading |
| AmriData | Website advertises a free starting workflow | Check its current plan for upload/AI quotas and supported capabilities |
| Local Python + open-source libraries | No AI subscription required for ordinary calculations | Requires setup; using a paid AI model alongside Python may incur costs |
If your file contains regulated, confidential, or identifiable information, the lowest advertised price should not be the deciding factor. First examine data handling and the controls available on your organization’s plan. A local spreadsheet or Python workflow can be safer for information you cannot upload to a third-party assistant.
Generative AI for Data Analysis
Generative AI adds a flexible language interface to analytical work. It can translate a loosely phrased question into a plan, generate code, explain a chart, suggest additional checks, and draft a report. A conventional machine-learning model usually has a narrower purpose, such as predicting churn or classifying a text label after training on suitable data. The two approaches can work together.
For example, a generative assistant may draft an appropriate training pipeline, while an underlying statistical or machine-learning library performs the actual fit and generates predictions. The assistant is not itself a substitute for checking feature leakage, class imbalance, calibration, and model performance on new data. For reliable numeric output, use executable code, spreadsheet formulas, or a database calculation rather than asking a chat model to mentally total thousands of values.
AI Agents for Data Analysis: When Workflows Become Multi-Step
An AI assistant normally responds to the next user request. An AI agent may be authorized to plan and execute a sequence: import a report, run quality checks, identify a discrepancy, create a chart, and prepare a draft for review. These terms overlap in product marketing, so look at what the system actually does and which actions it can perform.
| Assistant | Agent |
|---|---|
| Answers or generates output in response to a request | May coordinate several steps and tools |
| User chooses the next operation | May propose and execute intermediate operations |
| Often limited to current exchange | May handle connected sources or recurring tasks if configured |
| Requires output review | Requires permissions, boundaries, logs and approval gates |
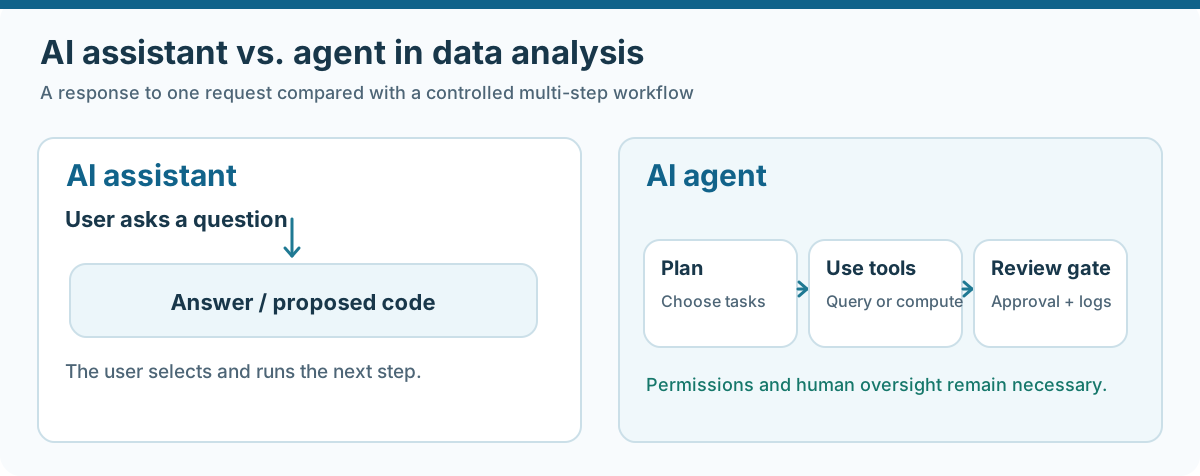
A useful agent can prepare a monthly report and flag changes; it should not independently delete original records, publish an unverified public report, approve a loan, or take another high-impact action just because a chart looks unusual. Keep its data access narrow and require human approval for consequential writes or decisions.
AI for Excel Data Analysis
There are three common approaches. Work inside Excel with Copilot when your license and version support it; upload an XLSX or CSV to a compatible AI assistant; or import the spreadsheet into a dedicated data-analysis interface. Before any of these, format data as a clear table, name columns, remove mixed subtotal rows, and state how blanks and refunds should be treated.
For a practical prompt, try: “In this workbook, one row is one invoice. Identify duplicate invoice IDs, show revenue by month excluding canceled invoices, and provide the exact grouping formula or code. Do not overwrite the original sheet.” For PivotTables, Power Query, ToolPak and conventional Excel analysis, use the dedicated Excel data analysis tutorial.
AI for Data Analysis and Visualization
AI is helpful when the chart question comes first: “Show weekly revenue over time,” “Compare return percentages across channels,” or “Display the distribution of delivery days.” It may propose a line chart, a bar chart, or a histogram respectively. The choice still has to match the data: histograms group numeric intervals; bar charts compare discrete categories. The guide to choosing the right chart explains the decision in more detail.
Check each AI-generated chart for the actual row filter, numerator and denominator, unit, date completeness, missing categories, axis baseline, and any aggregation that hides subgroup differences. A chart can be visually attractive and still be wrong. See common data visualization mistakes and the longer guide on data analysis dashboards. For quick manual checks, use the Bar Chart Maker or Line Graph Maker.
AI for Qualitative Data Analysis
Interviews, open survey questions, reviews, and support transcripts are not numerical tables waiting for a mean. A model can propose a preliminary coding scheme, suggest similar passages, cluster recurring language, and help retrieve exact quotations from a source corpus. Whether those categories represent meaningful themes is a separate interpretive decision.
Suppose you have 100 responses to “What made checkout difficult?” Read a subset yourself first. You might see confusing delivery fees, account creation problems, and payment errors. Ask AI to apply a documented provisional codebook while retaining an ID and exact source excerpt for each classification. Then review ambiguous, negative and minority cases. Change the codebook if the responses demand it rather than forcing every statement into the first three categories.
- Define the research question and coding approach.
- Remove or mask identifiable information when appropriate and permitted.
- Review an initial sample and draft a codebook.
- Ask AI to suggest codes with response IDs and source-grounded excerpts.
- Inspect disagreements, sarcasm, multi-topic answers and unusual cases.
- Revise categories, document decisions, and reread supporting evidence.
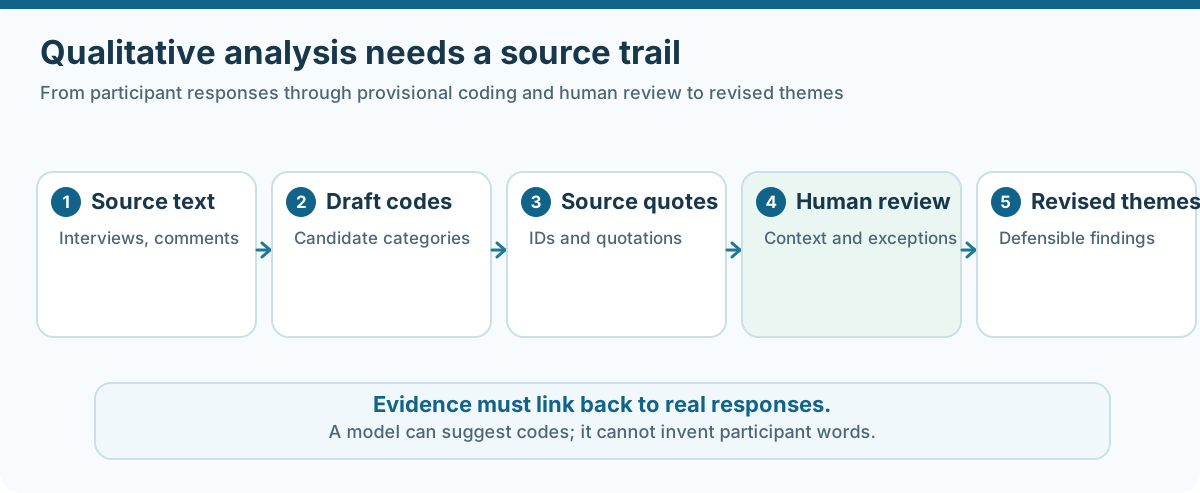
Never publish an invented participant quote. Not every qualitative method calls for coder-agreement statistics; methodological choices should fit the study rather than a generic AI checklist.
AI for Quantitative and Statistical Data Analysis
Structured data can support descriptive statistics, frequency tables, cross-tabs, tests, regression, classification, and forecasting. The central question is not “Can the tool run it?” but “Does this calculation fit the unit, outcome, sampling design and decision?” A code-enabled assistant can execute a regression and explain coefficients, yet still misread two visits by one customer as independent people.
Ask it to show the number of observations included, the missing-value policy, outcome definition, model terms, assumptions, diagnostics, and uncertainty. With predictive work, compare to a baseline and evaluate performance on data not used to fit the model. With correlation, never infer cause without a suitable design. Read data analysis methods for the deeper methodological choices.
AI for Large Datasets and Advanced Analysis
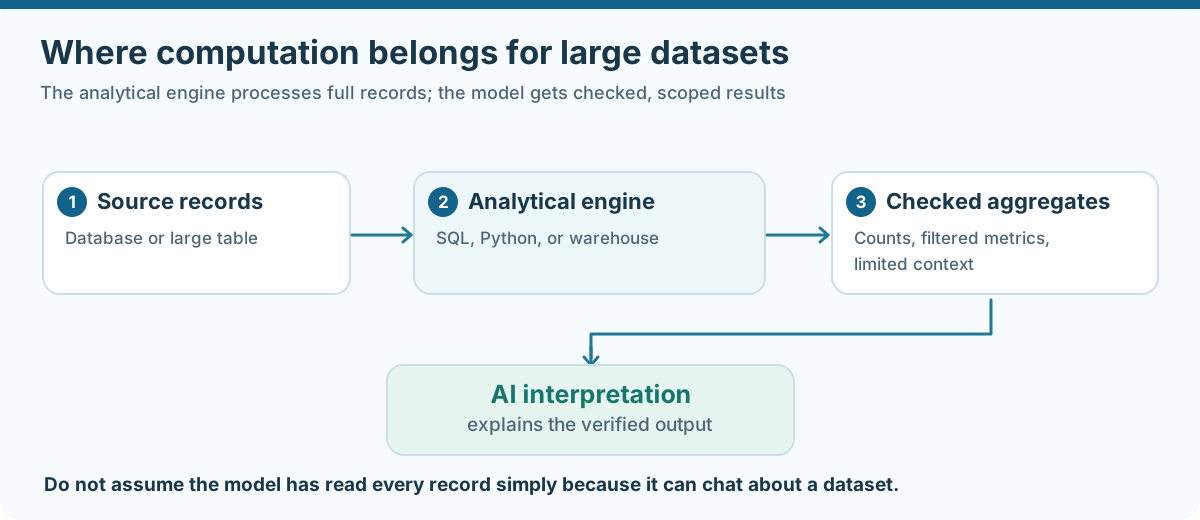
Large files introduce different engineering constraints: memory, token or context windows, database permissions, data locality, and cost. Do not assume that uploading a million-row table means a language model examined every row. A reliable architecture lets the analytical engine scan and aggregate records; the model receives a schema, safe sample, validated statistics, and narrowly scoped tool results to explain.
For example, a database might compute monthly sales and missing-value counts using SQL. An AI assistant could then help interpret the grouped output. If the question changes, it should request another query rather than invent a number. Protect credentials, enforce read-only access where possible, cap query costs, and avoid returning unnecessary personal records to the AI context.
How to Use AI for Data Analysis: A Step-by-Step Workflow
Try this sequence on a small, non-sensitive dataset before asking AI to automate an entire reporting process.
- State the question. “How did the percentage of returned orders differ between web and app orders in September?” is testable. “Find insights” is not specific enough to audit.
- Explain each row. Specify order, item, person, session, or date as the unit; document every derived field and the currency or measurement unit.
- Inspect completeness. Check counts, duplicate keys, missing dates, blank measures, suspicious values, and excluded records before making comparisons.
- Request descriptive checks. Calculate totals, medians, category counts, and correct subgroup denominators. Ask for the calculation method or code.
- Choose a suitable method. A percentage comparison may be enough for description. Inference requires information about sampling and dependence; forecasting requires time-ordered validation.
- Build an appropriate chart. Name the numerator, denominator, units and time range. Reject a chart that exaggerates changes through a misleading axis.
- Reproduce a key result. Check it independently in Excel, SQL, Python, or the source table. Make the model correct any mismatches.
- Write a cautious conclusion. Distinguish observed differences from explanations, report uncertainty when appropriate, and note what further evidence would be needed.
For a product-led version of the first steps, review AmriData's data-analysis workspace and its visualization features.
Worked Example: Can You Verify the AI's Answer?
Here is a deliberately small, fictional e-commerce file. Each row represents one unique order. Revenue is the recorded value before any refund adjustment. The returned field is a yes/no order flag; the example does not say why a return occurred. This is an educational dataset, not a test of any named AI product.
| Order | Channel | Revenue ($) | Returned? |
|---|---|---|---|
| O-01 | Web | 40 | No |
| O-02 | App | 60 | Yes |
| O-03 | Web | 80 | No |
| O-04 | App | 100 | No |
| O-05 | Web | 50 | Yes |
| O-06 | App | 70 | No |
| O-07 | Web | 90 | No |
| O-08 | App | 110 | Yes |
A model might report, “The app has more returns, therefore using the app increases returns.” The first clause is a descriptive pattern in this toy sample; the causal conclusion is unjustified. We do not know the customer mix, products, assignment process, or sampling method.
Recalculate the example without AI
The eight amounts are 40, 60, 80, 100, 50, 70, 90 and 110 dollars. Sort them to find the middle two values, 70 and 80. Their mean is $75, the median order value. The recorded total is $600; this is order value before any adjustments for returns or refunds.
| Measure | Result | Check |
|---|---|---|
| Orders | 8 | Count unique order IDs |
| Total recorded order value | $600 | 40 + 60 + 80 + 100 + 50 + 70 + 90 + 110 |
| Median order value | $75 | (70 + 80) / 2 |
| Web return percentage | 25% | 1 returned / 4 web orders |
| App return percentage | 50% | 2 returned / 4 app orders |
The percentages describe only these eight invented records. They neither show a statistically reliable difference in a population nor establish that choosing the app caused a return.
For this example, the order value is not the same as the margin, cash collected, or refunded amount. To answer a business profitability question, we would need additional fields and definitions. That missing context is the kind of limitation an AI analysis should state up front.
AI Prompts for Data Analysis You Can Reuse
A strong analytical prompt names the question, the data grain, the measures, the desired output, and the checks that would disprove a bad answer. Instead of “Analyze these sales,” ask the assistant to inspect the structure first and show how it calculated each reported number.
Copy-ready AI data analysis prompt
Prompt: “I have a dataset with one row per order and columns order_id, channel, revenue, and returned. First describe the row count, column types, missing values, duplicate IDs, and ambiguous business definitions. Then calculate the total recorded revenue, median order value, and return percentage separately for each channel. Show numerators, denominators, filters and runnable calculation steps. Do not infer causation. State what cannot be answered from these columns.”
Replace the field names and row definition with those in your own data. Do not send confidential records to an unapproved tool.
Useful prompt patterns for different tasks
- Data audit: “Identify field types, duplicate keys and missing values. Report affected row counts and do not modify records yet.”
- EDA: “For every numeric measure, show count, median, quartiles and distribution concerns; then propose three follow-up plots.”
- Group comparison: “Compute returned orders divided by eligible orders for each channel. Show both counts and rates, plus excluded records.”
- Time trend: “Aggregate weekly by the specified timezone, flag incomplete weeks and compare with a simple seasonal baseline.”
- Statistical review: “State the sampling unit, pairing, assumptions, method and effect-size estimate before interpreting any p-value.”
- Qualitative coding: “Suggest provisional categories, keep source response IDs and exact quotations, and mark uncertain cases for review.”
- Python: “Produce pandas code with assertions for input columns, explicit missing-value handling and a reproducible output.”
- SQL: “Produce read-only SQL, explain join cardinality, show distinct entity counts and verify the percentage denominator.”
Automated AI Data Analysis: Repeat a Checked Process
Automation is especially helpful when the same report is prepared weekly. A repeatable process can ingest a file, check its schema, compute totals, generate visualizations, and draft a narrative. AI may help construct or operate that process, but the calculations should remain deterministic where practical.
For example, a weekly sales pipeline can reject files without order_id or order_date, count duplicate orders, aggregate net revenue with a documented refund rule, and compare the latest complete week with the previous one. Only after those steps should a model write a summary. Put a review step before distributing results or modifying operational records.
Auto-generated insight summaries are not the same as autonomous decisions. See what automated insights are for the concept and its boundaries.
AI Data Analysis Examples by Industry
| Setting | Possible task | Important context |
|---|---|---|
| Marketing / SEO | Compare traffic sources, conversions and campaign dates | Attribution, bot traffic and seasonality |
| Sales / e-commerce | Explore returns, order values and customer cohorts | Revenue definitions, duplicate order lines |
| Education | Summarize question-level results or survey feedback | Student privacy, fairness and assessment design |
| Research | Audit files, propose coding or review model outputs | Sampling, reproducibility, ethics approvals |
| Finance / healthcare | Flag anomalies for authorized expert review | Specialized regulation, sensitive data and human oversight |
| Small business | Prepare a repeatable monthly sales and cost summary | Complete records, cash vs accrual definitions |
Good questions are specific to the available evidence. AI cannot compensate for a missing customer cohort, unknown pricing policy, or unreliable measurement simply by producing a longer report.
How Accurate Is AI for Data Analysis?
There is no universal accuracy percentage. An assistant may summarize a tidy, well-defined table correctly but choose the wrong denominator in a different file. A coding tool can calculate exact arithmetic and still answer the wrong question. Reliability depends on data quality, how much of the data the system actually uses, the analytical engine, instructions, task complexity, and whether someone checks the results.
Separate three accuracy questions. Computation: were the totals, sample sizes, and model outputs calculated correctly? Method: was an appropriate procedure chosen for the data and study design? Interpretation: does the written conclusion avoid unsupported causes and exaggerated certainty? Passing the first check does not automatically pass the other two.
How to Verify AI-Generated Analysis
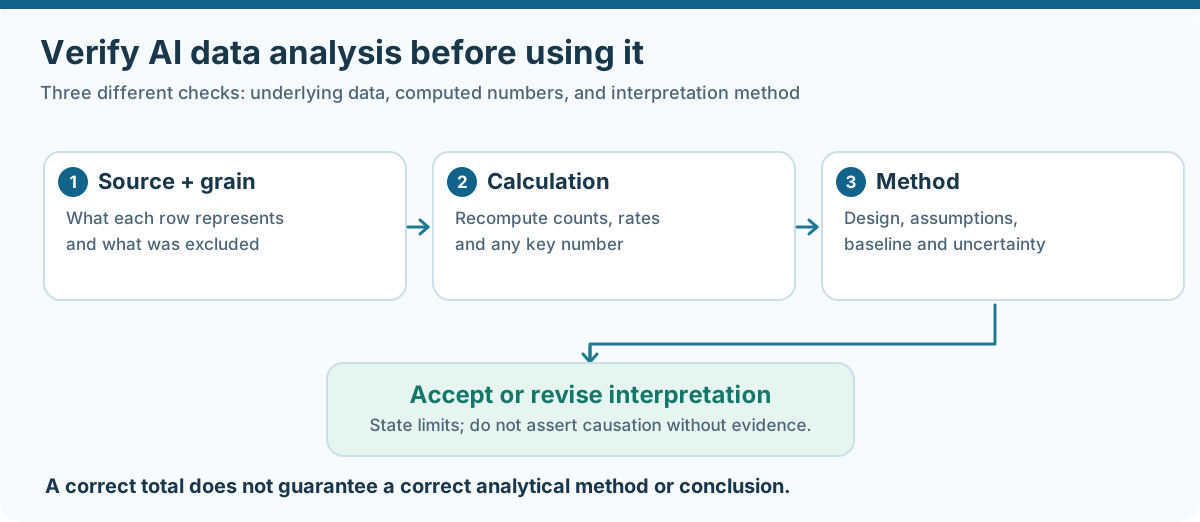
- Confirm the source and date range; document the meaning of a row.
- Check that group totals reconcile to an overall count or documented exclusions.
- Calculate one key figure independently using another method.
- Inspect duplicates, blanks, outliers, negative values and mixed units.
- Review joins, filters, denominators and timezones.
- Verify test assumptions, uncertainty and selection of a baseline.
- For forecasts, keep future observations out of training.
- For qualitative findings, follow each cited claim to real source text.
- Confirm that the written narrative does not confuse correlation with causation.
- Record the code, prompt, dataset version and manual corrections when reproducibility matters.
Common Mistakes When Using AI for Data Analysis
- Trusting the first confident answer: request the calculation and inspect source rows.
- Asking only “find insights”: give the decision question and required output.
- Ignoring row grain: order-line rows are not unique customers or unique orders.
- Using the wrong denominator: returned orders divided by all visits is not the same as a return rate among orders.
- Converting missing to zero: absence of evidence can carry a different meaning from a recorded zero.
- Deleting outliers automatically: unusual but legitimate records may be the most interesting observations.
- Picking a familiar statistical test: data type, pairing and study design decide suitability.
- Claiming cause from association: alternative explanations must be evaluated.
- Randomly splitting time series: future information can contaminate the evaluation.
- Trusting generated SQL or Python without tests: plausible code can silently duplicate or omit records.
- Confusing free access with unlimited rights or capacity: verify current plan and data settings.
- Publishing untraceable AI summaries: every meaningful number and quotation should have a source.
Privacy, Security and Responsible Use
Before uploading a dataset to an external AI tool, determine what it contains and whether your organization is authorized to transfer it. Names, email addresses, health records, student data, credentials, customer IDs, and commercially sensitive tables may require special handling. Removing names alone does not always make a dataset anonymous, especially when rare attributes can identify someone indirectly.
Review the vendor's current retention rules, access controls, model-training settings, business agreements, geography requirements, and available deletion process. Different plans can have different policies. For consequential work, keep a record of who approved the analysis, which dataset was used, and whether generated code or agents were allowed to access other systems. AmriData's own privacy policy and security information should be consulted for its platform.
When a result could affect employment, healthcare, credit, education, or legal outcomes, insist on a domain expert and a human decision-maker. AI assistance does not transfer accountability away from the organization using it.
Will AI Replace Data Analysts?
AI can reduce time spent writing routine queries, preparing drafts, or creating repetitive charts. Analysts still need to frame questions, define measures, recognize biased or incomplete data, design defensible comparisons, and explain tradeoffs to people who make decisions. Some roles and workflows may change significantly, but it is not possible to make one reliable yes-or-no prediction for every organization or team.
The separate article on how AI is changing data analysis examines broader workflow and career changes. This guide is about using it responsibly on a specific analytical task.
Frequently Asked Questions About AI for Data Analysis
What is the best AI for data analysis?
It depends on the job. ChatGPT and Claude can help with code and file-based reasoning; Gemini can suit Google workflows; Copilot in Excel fits Excel-based work; Julius focuses on analysis; and AmriData offers dataset-aware profiling and visualization. Compare actual computation, workflow fit, privacy, and cost rather than a generic ranking.
Can I use AI for data analysis free?
Several products offer free starting access with limits, and local Python can calculate data summaries without an AI subscription. Free AI plans may restrict uploads, usage, models or connectors. Review vendor terms before relying on a feature.
Can ChatGPT analyze CSV and Excel files?
Yes, according to OpenAI's documentation, supported ChatGPT experiences can analyze common spreadsheet files and generate tables or charts. File sizes, tool access and other limits depend on the account and environment. Important results still need checking.
Can AI analyze Excel data?
Yes. Depending on the tool, AI may work inside the Excel workbook or analyze an uploaded copy. Define the columns, formulas, missing data and grouping before asking for results. Keep the original workbook unchanged until you verify edits.
Can AI perform statistical analysis?
It can assist with method selection, generate and sometimes execute code, summarize outputs, and explain uncertainty. It may still miss sampling dependence, confounding or model assumptions. A statistically valid claim requires a defensible method and evidence.
Can AI create data visualizations?
Many current tools can generate or suggest charts. Check chart type, numerical values, axis scales, grouping, date coverage and labels. A good-looking visualization is not evidence that a calculation is correct.
How is generative AI different from predictive machine learning?
Generative AI is flexible at language, code and content creation. Predictive machine-learning models are built and evaluated for tasks such as estimating an outcome. Generative AI can assist in constructing or interpreting such models; it does not replace their evaluation.
Are AI agents better than AI chatbots for analysis?
Agents can coordinate multiple tool actions and recurring steps, which helps in controlled pipelines. That adds operational risk and does not guarantee statistical accuracy. A simple assistant may be better when the work needs close human judgment.
Can AI analyze qualitative interviews?
AI can propose codes, group related passages and locate relevant excerpts. Researchers must verify quotations, preserve context and use quality criteria appropriate to the qualitative approach.
Is it safe to upload customer data to AI?
Only when you have permission and the particular provider, plan and configuration meet your legal and organizational requirements. Minimize sensitive fields, review retention and training controls, and use local or approved enterprise processing when needed.
Can AI make mistakes even when it runs code?
Yes. Executed arithmetic can be exact but based on the wrong fields, filters, denominator or statistical procedure. Inspect the code and the assumptions, not merely the final numerical answer.
Does AI replace the need to learn data analysis methods?
No. Knowing the questions a method can answer, its assumptions and its limitations helps you judge whether an AI-generated result is meaningful. AI is a useful assistant, not a replacement for analytical judgment.
Key Takeaways
- Use AI for data analysis to speed up understanding, code, charts and written interpretation—not to bypass evidence.
- Choose the tool for the task and data environment; avoid unsupported best-tool scores.
- Use code, formulas or analytical engines for important calculations, then inspect inputs and methods.
- Verify row definitions, denominators, missingness, data quality, statistical assumptions and uncertainty.
- Keep private data protected and consequential decisions under human oversight.
If you are starting from scratch, choose a small, non-sensitive file, ask one precise question, and reproduce the answer independently. Browse more tutorials in the AI & Data category or explore AmriData AI Data Chat to see a dataset-aware workflow.
Related AI, Data Analysis and Visualization Guides
← Back to the AI & Data category
Sources, Review Dates and Example Methodology
Vendor capabilities and starting-plan descriptions were checked against the following first-party documentation on October 19, 2026. These references support feature descriptions, not comparative speed or accuracy claims.
- OpenAI — Data analysis with ChatGPT
- OpenAI — Uploading files to ChatGPT
- Google — Upload and analyze files in Gemini Apps
- Google Workspace — Gemini in Sheets
- Microsoft — Copilot in Excel FAQ
- Anthropic — File creation and analysis with Claude
- Julius — Features and current plans
- AmriData — AI Data Chat
- NIST/SEMATECH — What is exploratory data analysis?
- Braun & Clarke — Thematic analysis resources
Worked-example note: all eight orders above are invented for teaching. The displayed counts, revenues, median and channel return percentages are arithmetically verifiable from those rows. They are not a real user dataset, a controlled product benchmark, or evidence of any causal effect. Product access, prices and feature limits can change; recheck them before future updates.