
Data analysis methods are systematic approaches for examining data to answer particular questions. Some summarize values or compare groups; others measure associations, test statistical claims, forecast outcomes, identify clusters, or interpret interviews and written comments. The right method depends on the question, measurement scale, study design, data quality, assumptions, and the conclusion you need to defend.
For example, use descriptive statistics to summarize order values, cross-tabulation to compare categorical groups, regression to study an outcome in relation to predictors, and thematic analysis to interpret recurring ideas in interview transcripts. None of these methods is a universal substitute for the others.
Start with the question rather than a familiar test or tool. This guide goes further than the introduction to data analysis by showing how to select and evaluate specific methods. It belongs to the Data Analysis category.
Method comparisonQuantitative + qualitativeWorked examplesWhich Data Analysis Method Fits Your Question?
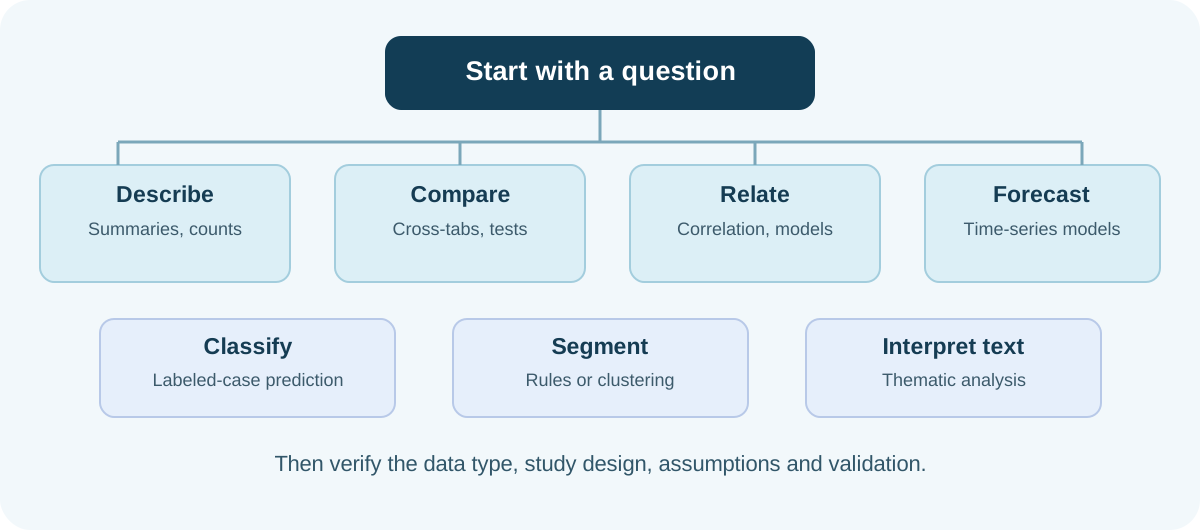
Use this quick guide as a starting point. The full choice still depends on variable definitions, data collection, independence, and model assumptions.
| Question you need to answer | Possible starting method | Check before using it |
|---|---|---|
| What is typical or unusually high? | Descriptive statistics and distribution plots | Measurement units, skew, missing values |
| Do two categories differ? | Cross-tabulation and percentages | Correct percentage denominator |
| Are numerical variables associated? | Correlation | Shape of relationship, dependence |
| How is an outcome related to predictors? | Regression | Outcome type, design, confounding |
| Do groups differ beyond sampling noise? | Design-appropriate inferential test | Paired/independent data, assumptions |
| What changes over time? | Time-series analysis | Ordering, seasonality, autocorrelation |
| Which cases are similar? | Clustering or rule-based segmentation | Feature scaling and segment stability |
| Which class is a new case in? | Classification | Unseen-data performance and error costs |
| Which concerns recur in comments? | Thematic or content analysis | Coding approach, context, interpretation |
What Are Data Analysis Methods?
A data analysis method is a reasoned way to turn observations into evidence about a question. A mean describes a typical recorded value; a cross-tabulation compares categories; a regression models an outcome; an interview-based thematic analysis interprets patterns of meaning. Different questions can lead to different valid analyses of the same records.
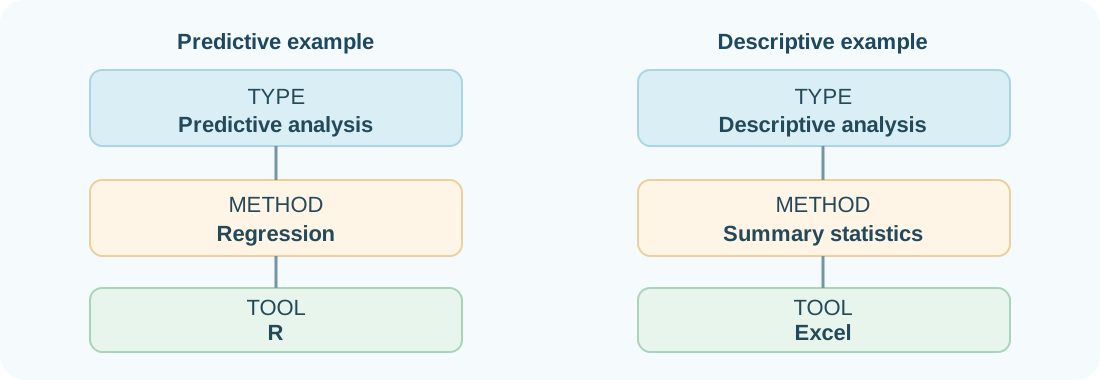
Methods vs types vs techniques vs tools
| Term | Meaning | Example |
|---|---|---|
| Analysis type | A broad purpose or question | Predictive analysis |
| Method | An analytical approach | Regression analysis |
| Technique | A particular procedure within an approach | Ordinary least squares estimation |
| Tool | Software used to perform or present work | R, Python, Excel, or suitable AmriData tools |
“Method” and “technique” often overlap in normal professional usage; this is a practical distinction, not a universally accepted taxonomy. Likewise, descriptive, diagnostic, predictive, and prescriptive are types of analysis, not a complete list of individual methods. Regression may contribute to description, adjustment, or prediction depending on how it is designed and validated.
Study design is different again. An observational study, randomized experiment, interview study, or longitudinal panel describes how evidence was obtained. A survey is usually a data-collection approach; its responses may later be analyzed with several different methods.
Quantitative vs Qualitative Data Analysis Methods
Quantitative data analysis methods examine counts, measurements, and numerical or numerically coded responses to describe magnitudes, estimate relationships, or evaluate uncertainty. Qualitative data analysis methods interpret material such as interviews, observations, and documents to understand meanings, experiences, processes, and patterns across accounts.
| Question | Quantitative | Qualitative |
|---|---|---|
| Typical input | Counts, numeric measurements, structured responses | Text, recordings, field notes, documents |
| Main goal | Estimate magnitude, frequency, differences or predictive patterns | Interpret meaning, context and participant accounts |
| Examples | Cross-tabs, correlation, regression, statistical tests | Thematic, content, narrative, discourse analysis |
| Common output | Tables, parameter estimates, intervals, predictions | Themes, categories, narratives, interpreted passages |
| Quality checks | Measurement, design, assumptions, reproducibility | Reflexivity, transparent analysis, fit between evidence and claims |
Neither is automatically more objective. A coded survey response still depends on question wording and sampling. A qualitative study still requires systematic decisions about coding and interpretation. Projects can combine both approaches when the research question requires it.
How to Choose the Right Data Analysis Method
Begin with a sentence containing the outcome and the decision: “I want to estimate whether return rates differ between mobile app and website orders,” not “I want to run a t test.” Then work through the following checks.
- Define the objective. Describe, compare, test, explain, forecast, classify, segment, interpret, or support a decision? One analysis may serve several goals, but the primary goal controls how success is judged.
- Identify variable meaning and type. Binary, nominal, ordinal, count, continuous measurement, time order, and open text need different handling. Coding “web” as 1 and “store” as 2 does not make channel a continuous variable.
- Identify the outcome and predictors. Are you summarizing one variable, comparing groups, or relating an outcome to several characteristics? Are there enough observations and events to support the analysis?
- Understand the design. Independent customers, repeated purchases by one customer, matched before/after measurements, and survey samples are not interchangeable. Randomization and observational sampling create different grounds for inference.
- Audit the data. Look at units, invalid dates, duplicate rows, missing values, definitions, selection bias, and unusual observations. Begin with exploratory data analysis and appropriate data cleaning.
- Check candidate assumptions. Consider functional form, independence, measurement, distribution where relevant, and whether the method fits the outcome scale.
- Decide whether the goal is description, inference, or prediction. Estimating a coefficient with uncertainty is not the same task as obtaining accurate predictions for new cases.
- Choose a defensible starting method. A clear frequency table may answer the question better than a complicated model. Add complexity only when the design and objective justify it.
- Validate, interpret, and revise. Check diagnostics, sensitivity, uncertainty, or held-out performance as appropriate. Findings may reveal that you need new variables, a better design, or a different question.
Interactive Data Analysis Method Guide
Choose the question and primary data type. This small guide suggests candidate approaches, not a guaranteed statistical test. In particular, the same variable types can require different methods for repeated observations, complex surveys, or causal research.
What are you trying to do?Select a goalSummarize or describeCompare groupsInvestigate a relationshipPredict an outcomeForecast over timeGroup similar casesInterpret comments or interviews What is the main outcome or material?Select the dataNumerical measurementCategory or yes/noOrdered ratingTime-ordered observationsInterviews or written comments Show candidate methodsResetSelect both fields to see a relevant starting point.
JavaScript is optional. The table above and method catalogue below contain the same guidance.
Common Quantitative Data Analysis Methods
The following methods are not a ladder from “basic” to “advanced.” Several overlap in real projects: EDA contains descriptive work, forecasting can use regression, and cohort analysis may lead to time-to-event modeling. Compare each method's question, suitable data, example and main limitation.
Find a method in this section Clear searchDescriptive statistics
Best questionSummarize the observed distribution or typical value.Best dataNumerical measurements and category counts.ExampleFor 200 orders, report median order value, quartiles, and range; use percentages for channels.Watch forThe mean can mislead with strong skew; summaries alone do not generalize to a population or identify a cause.Frequency analysis
Best questionHow often does each answer, event, or value occur?Best dataCategorical responses, discrete values, or grouped intervals.ExampleCount complaints by issue and report each as a percentage of the defined total.Watch forState the denominator and check missing and multiple-response categories.Cross-tabulation
Best questionHow do two categorical variables occur together?Best dataTwo categorical variables, such as channel and returned.ExampleCompare return percentages within web and app purchases.Watch forShow row or column percentages explicitly; cells with small counts need care.Exploratory data analysis (EDA)
Best questionWhat patterns, structure, errors, or assumptions need investigation?Best dataMost tabular datasets before formal modeling.ExampleReview missing values, distributions, unusual orders, and subgroup differences.Watch forExploration can generate hypotheses but does not confirm them on the same evidence.Correlation analysis
Best questionHow strongly do two variables vary together?Best dataPaired measurements or appropriate ranks.ExampleExamine whether higher order values tend to accompany higher satisfaction ratings.Watch forPearson summarizes linear association; Spearman concerns rank/monotonic association. Neither proves causation.Regression analysis
Best questionHow is an outcome related to one or more predictors?Best dataOutcome type determines model family: numeric, binary, counts, and others.ExampleModel probability of return from channel and product category with logistic regression.Watch forA coefficient is not automatically causal; inspect model form, dependence, confounders, and diagnostics.Hypothesis testing
Best questionAre data compatible with a specified null model?Best dataSampled outcomes and a defensible study design.ExampleEvaluate an experimentally randomized change in average checkout time.Watch forA p-value is not the chance the null is true; report effect sizes and uncertainty.Group comparison methods
Best questionHow different are independent or paired groups?Best dataNumeric or categorical outcomes from defined groups.ExampleCompare before/after delivery times from the same customers with a paired approach.Watch forA two-group problem does not automatically imply a t test; pairing, scale and assumptions matter.Time-series analysis
Best questionWhat structure appears in ordered observations?Best dataMeasurements indexed by time at meaningful intervals.ExampleExamine weekly orders for trend, seasonality and autocorrelation.Watch forA line graph is a display, not a model; temporal dependence changes standard inference.Forecasting
Best questionHow many orders might occur in future periods?Best dataHistorical observations, often time ordered.ExampleCompare a seasonal forecast with a simple last-week baseline.Watch forValidate on later periods; random shuffling can leak future information.Classification
Best questionWhich category is a new case likely to belong to?Best dataLabeled cases with categorical outcomes.ExamplePredict whether a new customer may churn using past labeled records.Watch forTest on unseen cases and assess precision, recall, calibration and false-alarm costs.Clustering
Best questionWhich unlabeled observations resemble one another?Best dataComparable variables representing each observation.ExampleGroup customers by purchase frequency and spending patterns.Watch forGroups depend on scaling, features and algorithm; they are not inherently real customer types.Rule-based segmentation
Best questionHow do defined groups behave differently?Best dataAttributes and transparent business definitions.ExampleCompare new vs returning customers or low vs high order-frequency bands.Watch forSegment boundaries may be arbitrary; disclose rules and avoid hidden subgroup bias.Cohort analysis
Best questionHow do groups sharing a start event change over time?Best dataDates and a consistent identifier and entry event.ExampleCompare 30-day retention for January and February sign-up cohorts.Watch forAllow comparable follow-up time; younger cohorts have less time to experience outcomes.Anomaly detection
Best questionWhich events depart from expected patterns?Best dataNumeric values, frequencies or modeled patterns.ExampleFlag unusually large refunds for manual verification.Watch forAn unusual value may be valid; investigate before deletion or accusation.Dimensionality reduction
Best questionCan many correlated measurements be summarized with fewer dimensions?Best dataMultiple numerical features; suitable preprocessing.ExampleUse PCA to explore a survey with many correlated standardized measures.Watch forLower-dimensional patterns may lose information and need interpretable validation.Time-to-event analysis
Best questionHow long until an event occurs, accounting for incomplete follow-up?Best dataEvent times and censoring indicators.ExampleEstimate time from signup to cancellation when some customers are still active.Watch forTreating censored observations as ordinary missing events biases conclusions.For distribution summaries, see mean, median and mode and standard deviation. The separate EDA tutorial provides the complete practical workflow.
Common Qualitative Data Analysis Methods
Qualitative data analysis methods do not mean casually reading comments and selecting a few quotations. The researcher specifies the analytical approach, attends to context, makes transparent interpretive choices and supports findings with the material. A study of experience may need something different from a study of how frequently predetermined categories occur.
Thematic analysis
Best questionWhat recurring patterns of meaning appear across responses?Best dataInterview transcripts or open-ended comments.ExampleInterpret customers’ descriptions of why delivery felt unreliable.Watch forThemes are analytical interpretations, not merely the most frequent words; reflexivity and approach matter.Content analysis
Best questionWhich categories of material occur and how are they presented?Best dataDocuments, posts, text answers and defined coding units.ExampleCode review comments into shipping, quality, payment and support categories.Watch forDefine coding rules and units; counts alone do not capture context or significance.Narrative analysis
Best questionHow do people construct and sequence experiences in their accounts?Best dataExtended interviews, diaries or stories.ExampleStudy a customer’s account of how an unresolved issue led to cancellation.Watch forPreserve sequence and context instead of fragmenting every statement into isolated keywords.Discourse analysis
Best questionHow does language construct positions, meaning or social relations?Best dataConversations, documents or recorded interaction.ExampleExamine how support transcripts frame blame and responsibility.Watch forInterpretation depends on theoretical approach and social context.Grounded-theory approaches
Best questionHow can an explanatory account be developed through iterative data collection and analysis?Best dataRich qualitative fieldwork or interviews with purposeful sampling.ExampleIteratively interview users to develop an account of how trust in a service forms.Watch forRequires more than labeling quotes; versions differ in coding, memoing and theory development.Text and sentiment analysis
Best questionHow are opinions or language patterns coded at scale?Best dataText corpora and clearly defined labels or categories.ExampleClassify comments by apparent sentiment, then review ambiguous examples.Watch forSarcasm, negation and domain language create errors; automated labels need validation.In reflexive thematic analysis, for example, themes are developed through sustained engagement with the material and an explicit interpretive stance; inter-coder agreement is not a universal requirement across all thematic approaches. In structured content analysis, a coding reliability check may be appropriate. Choose the quality criteria that fit the method rather than applying one checklist to every qualitative study.
Survey Data Analysis Methods
A survey can contain several kinds of evidence: age bands, binary answers, ordered satisfaction ratings, numerical amounts, and free-text explanations. A single “survey method” is therefore rarely enough.
- Frequencies and proportions: summarize each option and disclose the base number answering the item.
- Cross-tabulation: compare responses by group, using clearly identified row or column percentages.
- Ordinal summaries: describe the distribution of a Likert item; do not assume one coded 1–5 rating is a continuous measurement without justification.
- Design-aware estimation: use supplied survey weights and account for stratification or clustering where needed; the correct variance estimation can differ from a simple random sample.
- Open-ended responses: select content analysis, thematic analysis or another justified text approach.
Before interpreting a percentage, inspect who was invited, who responded, whether items were skipped, and whether weights were used. Weighting can help adjust known imbalances, but cannot automatically fix all nonresponse or coverage bias. The American Association for Public Opinion Research's best-practice guidance discusses sampling, transparency and analysis.
Statistical Data Analysis Methods: Description, Inference and Prediction
“Statistical data analysis methods” usually refers to statistical summaries, probability-based inference, and models for association or prediction. These objectives are related, but the evidence and checking requirements are different.
Description
Summarize the records you observed. Counts, medians, quantiles and plots help report their structure without claiming that the sample identifies a population effect.
Inference
Use sample evidence and an explicit probability or design framework to estimate population quantities, compare compatible hypotheses or quantify uncertainty. Evaluate assumptions and sampling design.
Prediction
Estimate unknown outcomes in new cases. Evaluate generalization on held-out records; use chronological validation for time-series forecasts and compare with simple baselines.
For group differences, outcome type matters but so do pairing, repeated measurements and assignment. Continuous independent-group outcomes may suggest t-based, regression or robust alternatives; categorical counts may suggest contingency-table or regression approaches. A method should not be chosen solely because a dataset has “two groups.”
A small p-value is not the probability that a null hypothesis is true, and a statistically significant association may be too small to matter operationally. Prefer effect size, interval estimates, diagnostics and subject-matter context in reporting. See OpenStax on correlation for a helpful treatment of association and causation.
Mixed-Methods Data Analysis
Mixed methods intentionally links quantitative and qualitative strands within a research design. A survey might estimate that 70% of a sampled group experienced delivery confusion, while follow-up interviews investigate how tracking messages created that confusion. The number is a hypothetical example, not an AmriData customer finding.
The useful part is integration: deciding how participants are selected for interviews, how disagreements between evidence sources are interpreted, and how conclusions combine measurement with explanation. Simply adding a quote below a chart does not by itself constitute a mixed-methods design.
Data Analysis Method Selection Matrix
Read across from the goal and the outcome. The suggestions are families, not automatic instructions to run a test.
| Goal | Outcome or input | Candidate method | Design issue to check |
|---|---|---|---|
| Describe | Numeric | Median, quartiles, distribution | Sampling, spread, outliers |
| Describe | Category | Frequency table, percentages | Missing responses, denominator |
| Compare | Binary/category | Cross-tabulation; appropriate inference if required | Independent vs paired; survey weights |
| Compare | Numerical | Group summaries; suitable comparison model | Independence, outcome distribution, design |
| Relate | Numerical/ordinal | Correlation; suitable regression if needed | Form, confounding, repeated observations |
| Predict | Binary label | Classification or logistic regression | Label validity; test-set separation |
| Forecast | Time-ordered measure | Time series and benchmark forecasts | Temporal split; seasonality |
| Segment | Multiple attributes | Business rules or clustering | Feature scaling; segment stability |
| Interpret | Text/interview | Thematic, content, narrative or discourse analysis | Research purpose; coding transparency |
One Dataset, Different Methods: E-Commerce Example
Consider the following eight fictional orders. This deliberately tiny dataset demonstrates the mechanics of method selection, not real customer behavior, reliable statistical inference, or enough history to train a predictive model.
| Date | Order | Channel | Value ($) | Returned? | Satisfaction (1–5) | Comment |
|---|---|---|---|---|---|---|
| Sep 1 | 001 | Web | 48 | No | 4 | Checkout clear |
| Sep 2 | 002 | App | 92 | Yes | 2 | Arrived late |
| Sep 3 | 003 | Web | 64 | No | 5 | Easy ordering |
| Sep 5 | 004 | App | 210 | Yes | 1 | Wrong size |
| Sep 7 | 005 | Web | 35 | No | 3 | Tracking confusing |
| Sep 10 | 006 | App | 115 | No | 4 | Checkout quick |
| Sep 12 | 007 | Web | 78 | Yes | 2 | Damaged box |
| Sep 15 | 008 | App | 25 | No | 5 | Product was good |
Six questions, six different approaches
- What was a typical order value? Sort the eight amounts and take the median: ($64 + $78) / 2 = $71. Descriptive statistics answers the observed-data question directly.
- Which channel had a larger return percentage? Cross-tabulate channel and return status. Web has 1/4 = 25% returned; App has 2/4 = 50%. These are descriptive differences in an invented sample, not evidence of a channel effect.
- Does order value vary with satisfaction? A scatterplot and rank-based association might be an exploratory start, since the single 1–5 satisfaction item is ordinal. Eight observations cannot support a strong general conclusion.
- How many orders will arrive next month? A forecasting question requires a much longer, consistently recorded time series and chronological holdouts. These eight dates cannot justify a credible forecast.
- Are there distinct customer segments? Segmentation would need customer-level features across multiple purchases, not just one row per order here. Otherwise clusters may merely reflect arbitrary order sizes.
- What complaints recur in written feedback? Read and code the texts. Delivery, tracking, sizing and packaging concerns appear in this illustrative set; thematic interpretation needs much richer material and context.
Method choice is iterative: a descriptive result may reveal that a different question, unit of analysis, or data source is required. The correct conclusion is sometimes “collect better data.”
Data Analysis Methods and Tools
A method is the analytical approach; a tool is software that implements some parts of the work. Familiar software does not make an unsuitable method appropriate.
| Tool | Useful for | Watch for |
|---|---|---|
| Excel / Google Sheets | Summaries, pivots, basic charts | Manual errors, scale and reproducibility |
| SQL | Filtering, joining, summarizing database records | A query is not a statistical study by itself |
| Python / R | Reproducible modeling and specialized analysis | Code, design, diagnostics and validation still need review |
| SPSS or specialist software | Supported tests, models and reporting | Defaults may not match the data or design |
| AmriData | Available data-cleaning, chart and explanatory workflows | Verify a specific feature exists before expecting modeling support |
For exploration, the Histogram Maker helps display numeric distributions; the Box Plot Maker summarizes medians and quartiles; the Bar Chart Maker handles categorical comparisons; and the Line Graph Maker visualizes sequences. A chart does not perform hypothesis testing, time-series modeling or causal inference by itself.
See how to choose a chart type for presentation decisions, the free tools directory for available utilities and AmriData’s Data Analysis feature for the current product workflow. For more specialized methods, use software that explicitly supports the needed model or analysis.
Assumptions, Data Quality and Validation
Even a correctly executed calculation can answer the wrong question. These checks apply across different methods, although their details vary by approach.
Sample size and sampling
More observations often improve precision, but they cannot fix selection bias, incorrect variable definitions or a flawed design. A sample of repeated transactions from ten customers is not necessarily equivalent to the same number of independent customers.
Missing values and unusual observations
Document which values are absent and why. Missingness concentrated in a subgroup can bias comparisons. Inspect extreme orders for recording errors or meaningful rare events before excluding them. Use box plots to explore spread, not as an automatic delete rule.
Inference is not prediction
An inferential model may emphasize a parameter and its uncertainty under assumptions; a predictive model emphasizes performance on unfamiliar observations. A precise coefficient does not guarantee good predictions, and a useful prediction does not identify a causal mechanism.
Diagnostics and multiple testing
Check residual patterns or fit where relevant, declare how many comparisons are being made, and resist selecting only attractive findings after testing many alternatives. For classifiers, inspect error costs as well as accuracy. For forecasts, separate the future from the training period. Report uncertainty and limitations in plain language.
Causation requires more than association
Finding that orders are larger on app than web does not show that the app caused larger orders. Promotion exposure, customer mix and product availability may differ. Stronger causal claims require appropriate experimental or observational designs and explicit assumptions.
Common Data Analysis Method-Selection Mistakes
- Choosing a test before defining the question. Write the decision, outcome and unit of analysis first.
- Confusing an analysis type with a method. “Predictive” does not specify a model; “diagnostic” does not prove a cause.
- Using the mean for every numerical variable. Inspect skew, units, zero inflation and extreme observations.
- Assuming association implies causation. Study design and confounding matter.
- Running a t test whenever there are two groups. Consider the outcome scale, pairing and sampling process.
- Shuffling time-series rows at random. This can place future information in training data.
- Applying k-means to mixed unscaled variables. Distance and feature coding drive the groups.
- Deleting all apparent outliers. Verify the underlying records and use a defensible rule.
- Treating qualitative analysis as word counting. Meaning, context and interpretation often matter more than raw frequency.
- Believing complex tools guarantee better answers. Validate against a simpler method and the real question.
- Using AI output without checking methodology. AI can suggest options or code, but it does not know every sampling or causal assumption in the project.
Methodology and communication are connected. Review common data visualization mistakes before presenting conclusions.
Frequently Asked Questions About Data Analysis Methods
What are the main data analysis methods?
Common methods include descriptive statistics, frequency analysis, cross-tabulation, correlation, regression, hypothesis testing, time-series analysis, forecasting, clustering, classification, thematic analysis and content analysis. They answer different kinds of questions.
What are the four types of data analysis?
A commonly taught business framework uses descriptive, diagnostic, predictive and prescriptive analysis. These are broad purposes; methods such as regression, cross-tabulation and thematic analysis are more specific approaches.
What is the difference between a data analysis method and a tool?
A method is an approach for answering a question, such as regression or thematic analysis. A tool is software—such as Excel, R, Python or an AmriData chart tool—used to carry out suitable parts of the analysis.
What are quantitative data analysis methods?
They use numerical measurements or coded information to summarize, compare, model, estimate or predict. Examples include descriptive statistics, cross-tabulation, correlation, regression and group-comparison methods.
What are qualitative data analysis methods?
They interpret non-numerical material such as interviews, open responses or documents. Thematic, content, narrative and discourse analysis are examples, with different theoretical aims and quality standards.
What are statistical data analysis methods?
They include statistical summaries, estimation and tests that quantify uncertainty, and models for association or prediction. Their appropriateness depends on sampling, measurement, study design and assumptions.
Which method should I use to compare groups?
First identify whether the outcome is numeric or categorical and whether observations are independent, paired, repeated or survey-weighted. Start with descriptive group summaries, then select an inferential procedure that matches the design if inference is needed.
What method works for survey data?
Frequency tables and cross-tabs are common starting points; ordinal questions, complex sampling and open-text responses may call for different methods. Report denominators, missing responses and any weighting.
Is Excel a data analysis method?
No. Excel is a software tool. Descriptive statistics, cross-tabulation and regression are examples of analytical methods that may be implemented in suitable software.
Can AI choose the right analysis method?
AI can propose candidate methods and explain software options. It may lack essential details about measurement, design, sampling and intended conclusions. Important work still needs human methodological review.
What is the best data analysis method?
There is no universal best method. A good choice is one that answers the defined question using suitable data and a defensible design, with assumptions, uncertainty and validation addressed.
Is data visualization a data analysis method?
A chart is primarily a representation. Plotting can be a technique within exploratory analysis, but a histogram or line graph on its own is not the same as estimating a model or testing a hypothesis.
Key Takeaways
- Begin with the question and the intended conclusion. A familiar algorithm is not a research question.
- Differentiate broad analysis types, actual methods, implementation techniques and software tools.
- Variable meaning, study design, dependence and data quality are as important as the number of variables or groups.
- Quantitative and qualitative data analysis methods answer complementary questions and can be intentionally combined.
- Association does not establish causation, significance is not practical importance, and forecasting requires honest out-of-sample checks.
When unsure, start with a simple descriptive view, investigate the data, and write down what additional evidence would change your choice. More Data Analysis guides are available in the parent category.
Related Data Analysis Guides and Tools
← Back to the Data Analysis category
References and Example Notes
- NIST/SEMATECH e-Handbook, Exploratory Data Analysis — assumptions, exploration and structure.
- OpenStax, Correlation Coefficient — relationship and causal limitations.
- AAPOR, Best Practices for Survey Research — survey interpretation, weighting and transparency.
- Braun and Clarke, Thematic Analysis — resources on reflexive thematic analysis.
Example methodology: the eight-order e-commerce table is an invented educational dataset, not platform output or a customer sample. The median ($71) and the descriptive web/app return shares (25% and 50%) can be checked from the eight records. No statistical significance, customer behavior, predictive accuracy or causal effect is claimed.