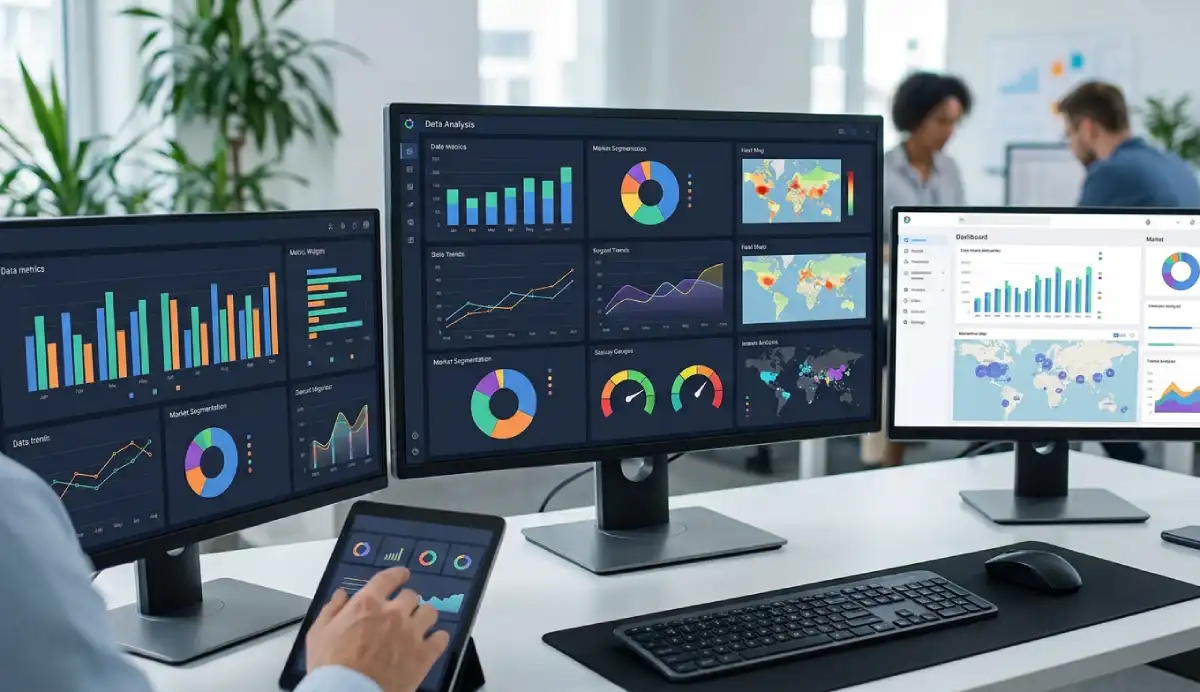
A data analysis dashboard brings important metrics, charts, filters and supporting details into one view so people can monitor performance and investigate changes. A useful dashboard starts with an audience and a decision, not a list of charts. It puts a small set of defined KPIs next to comparisons, trends, targets and a path to the underlying records. The result should help someone notice what changed, find where it changed and decide what deserves a closer look.
Imagine a shop manager opening Monday's sales dashboard. Revenue is below plan, but orders are up. Is the problem lower order value, a weak product category or a difference in reporting periods? The dashboard should help the manager check those possibilities instead of leaving them to guess from colorful charts.
This guide belongs to AmriData's Data Visualization guides. It covers dashboard anatomy, design decisions, KPI formulas, a worked ecommerce example, chart selection, software and the checks to perform before anyone relies on the numbers.
ILLUSTRATIVE DASHBOARD · SYNTHETIC DATAA sales dashboard that answers a question
Can our ecommerce manager meet the September revenue target, and which region needs attention?
Educational demo · not AmriData's live dashboard builder September 2026Full month · USD · all timestamps UTC Region All regionsWestEastCentralSouthReset filter Revenue$248,300September · selected region Vs. August−7.0%−$18,700 · prior full month September target99.3%$248,300 of $250,000 Remaining to target$1,700Target less actual; zero if metRevenue trend
Apr–Sep 2026 · USD Monthly revenue trend AprMayJunJulAugSepRevenue by region
September 2026East$74,400Central$62,600West$58,500South$52,800Revenue by category
Same region filterA$100,800C$78,100B$69,400What should the manager check next?
Revenue is $1,700 below target and $18,700 below August. West declined by $21,500, more than the overall decrease; other regions partly offset it. Category B is also down. A cross-tab is needed to check how much of the category decline happened in West.
A pattern is not a proven cause. Changes in prices, mix, stock availability or measurement rules would need separate investigation.
Showing all regions; all demo charts use the same September filter.Fixed example; no live feed or user dataInteractive example: change the region to see the KPI cards, trend and category comparisons update together. The figures come from a small synthetic dataset defined in this page's JavaScript. This is a teaching example, not a screenshot or feature of the AmriData application.
Dashboard anatomy at a glance
- Purpose: the audience, question and likely action.
- KPIs: a few performance measures with definitions.
- Trends: how measures change across comparable periods.
- Comparisons: where changes are concentrated.
- Filters: controlled ways to investigate segments.
- Details: rows or reports needed to verify the picture.
Before building: Who will use it? What decision do they make? Which source data answers that decision? How quickly can they act if a number changes?
On this pageDefinitionDashboard vs. reportKPIsAnatomyChartsLayoutFiltersValidationBuild stepsWorked exampleToolsFAQWhat Is a Data Analysis Dashboard?
A data analysis dashboard is a visual interface that places selected measurements, trends, comparisons and supporting details together so users can monitor results and investigate questions without rebuilding every analysis from raw records. A data analytics dashboard and an analytical dashboard are related names; the precise emphasis varies by team. One organization may use “analytics dashboard” for interactive exploration and “KPI dashboard” for a compact monitoring view.
Its real job is narrower than “show all the data.” For a regional sales manager, the job could be to identify whether monthly revenue is on target and determine which region and category account for the biggest shortfall. That statement gives the dashboard a test: if the manager cannot answer the question, another chart may not help.
What should the dashboard help you do?
A useful dashboard moves through three questions: What changed? Check KPI values, targets and prior periods. Where did it change? Inspect the relevant region, channel, product or cohort. What do we do next? Open the supporting records, validate the finding and investigate plausible explanations. A bar chart can point to a struggling region; by itself it cannot establish the cause.
Strategic, operational, analytical and executive dashboards
| Type | Main decision | Typical content | Review cadence |
|---|---|---|---|
| Strategic | Are we moving toward long-term goals? | Growth, margin, retention, targets | Weekly to quarterly |
| Operational | What needs attention during normal work? | Queues, backlog, failures, delays | As often as decisions need |
| Analytical | Which segments or patterns explain a result? | Comparisons, distributions, filters, detail tables | On demand or recurring |
| Executive | Which outcomes need leadership attention? | Few KPIs, targets, notable exceptions | Weekly or monthly |
These labels overlap. An executive view may be strategic, while an operational dashboard can have analytical drill-downs. Choose the purpose rather than trying to follow a rigid classification.
Dashboard vs. Report vs. Data Visualization
A dashboard supports repeated checks of selected signals. A report leaves more room to explain findings, methodology, limitations and the reasoning behind a recommendation. An individual visualization—say, a line chart of weekly revenue—usually handles one question. The dashboard coordinates several relevant views so they work together.
| Question | Dashboard | Report | Single chart |
|---|---|---|---|
| Primary job | Monitor and explore | Document and explain | Show one relationship or comparison |
| Typical content | KPIs, charts, filters, details | Narrative, tables, charts, methods | One encoded data view |
| Typical use | Revisited when needed | Read as a deliverable | Embedded in either |
| Interactivity | Often, but not always | May be interactive | Optional |
Neither format replaces the work of data analysis: data still need preparation, statistical examination and interpretation. Business intelligence is broader still, potentially covering data pipelines, modeling, governance and access permissions as well as dashboards. Note that some tools use “dashboard” and “report” as product-specific terms: Microsoft's Power BI service, for example, has a one-page dashboard feature distinct from its filterable reports.
How to Choose Dashboard KPIs (and Avoid Vanity Metrics)
A metric is anything measured: visits, orders, response time or revenue. A key performance indicator (KPI) is a metric connected to a particular objective or target. Page views might be a useful diagnostic metric for a marketing team; gross profit may be a headline KPI for a manager responsible for profitable growth. Not every number deserves the first row.
Start with the decision. If a manager needs to know whether sales are growing profitably, revenue alone is not enough: a profit or margin measure may belong at the top, while orders, average order value and refund rate provide explanation below it. Ask: If this number changed, would anyone know what to check or do? If the answer is no, it probably belongs in a supporting view or not on the dashboard.
Write down the formula before choosing the visual
Each KPI needs a definition that survives a change in analyst or software. Record its formula, unit, denominator, data source, period, timezone, excluded records, update schedule, target and owner. “Conversion rate” is incomplete until you know whether the denominator is visits, sessions or eligible leads.
| Measure | Example definition | Check before using it |
|---|---|---|
| Net revenue | Eligible sales less defined discounts/returns, per period | Are refunds and tax treated consistently? |
| Average order value | Order revenue ÷ eligible orders | Same order scope in numerator and denominator? |
| Session conversion rate | Converting eligible sessions ÷ all eligible sessions × 100 | What counts as a session and a conversion? |
| Refund order rate | Refunded eligible orders ÷ eligible orders × 100 | Same period or refund-event cohort? |
The formula matters as much as the color on a KPI card. If a customer makes ten orders, there are ten orders but one distinct customer. If Region A has 10 conversions in 100 eligible sessions (10%) and Region B has 90 in 300 (30%), the combined rate is 100 ÷ 400 = 25%, not the unweighted average of 20%. Weighting group percentages equally changes the question.
Put a comparison next to every headline number
“Revenue: $248,300” tells you the amount. “Revenue: $248,300; $1,700 below a $250,000 target; down 7.0% from a comparable prior month” tells you where to look. A useful KPI card can show the current value, unit, period, prior value or target, delta and last refresh. Do not cram every diagnostic into the same card.
Ordinary percent change is (current − previous) ÷ previous × 100%. If the previous value is zero, that calculation is undefined; label the result as not applicable rather than showing infinite growth. Also distinguish percentage points from relative change: moving from a 10% conversion rate to 12% is +2 percentage points or +20% relative, not “up 2%.”
Choose comparable periods. Comparing October 1–18 with all 30 days of September is usually misleading. Use month-to-date against the same elapsed portion of the earlier month, or label the incomplete month plainly. Seasonal businesses may need year-over-year comparisons rather than a neighboring month.
Essential Parts of a Data Analysis Dashboard
1. KPI cards: what matters now?
Start with three to six carefully selected KPIs only if each earns its place. This is a design starting point, not a statistical law. A support lead may need queue size and overdue cases; an ecommerce manager may need revenue, margin and conversion. Label the metric and its unit, specify the reporting period and include comparison or target context where meaningful.
2. Trend charts: when did the change happen?
Time series reveal whether a result is isolated or part of a pattern. Line charts suit ordered time values. Use the same date boundaries across related charts, and mark partial periods or changes in measurement rules. A trend can suggest which period to investigate but does not prove causation.
3. Comparisons: where is the difference?
Sorted horizontal bars work well for revenue by region, returns by product or tickets by issue type. Compare not only raw totals but rates when group size matters: 50 returns among 500 orders is different from 50 among 5,000. A table provides precision when readers need to inspect exact records.
4. Targets, exceptions and meaningful context
Show targets when somebody actually owns them and the threshold is documented. Alert on an exception that warrants a response, not on arbitrary red and green cutoffs. If lower values are better for response time but higher values are better for revenue, the labels should make that difference clear.
5. Filters, detail records and data freshness
Users may need date, region, channel or category filters. State which charts those filters affect and keep active selections visible. A detail table should let someone trace a surprising total to product or transaction records. The reporting period, last successful refresh and timezone belong in plain sight.
Which Charts Should a Dashboard Use?
Match the visual to the question rather than choosing from a gallery. The point of a dashboard chart is to make a specific comparison or change easier to understand. If you need a deeper chart-by-chart breakdown, see how to choose the right chart type.
| Dashboard question | Usually useful | Watch out for |
|---|---|---|
| How is revenue changing over time? | Line or area chart | Irregular intervals and partial periods |
| Which region has the biggest gap? | Sorted horizontal bars | Nonzero bar baselines that distort magnitudes |
| How is the mix changing? | Stacked bars; 100% stacks for shares | Showing shares when total volume also matters |
| Do two numeric measures move together? | Scatter plot | Interpreting association as cause |
| What is the distribution of wait times? | Histogram or box plot | Hiding spread behind one average |
| Where are failures concentrated by day/hour? | Heatmap | Color scales without labels or legend |
| Which exact records need checking? | Sortable detail table | Replacing useful numbers with visual decoration |
Pie or donut charts can work for very few categories with a clear whole, but bars are generally easier for precise ranking. Use a funnel only if the steps genuinely form a sequential process. Use waterfall charts when the question is how positive and negative components bridge two totals. Avoid 3D treatments and casual dual y-axes: both can obscure comparisons. An ordinary bar chart should usually start its value axis at zero; a line chart may use a narrower clearly labeled range when appropriate.
If you are examining shape and spread rather than performance totals, use the Histogram Maker or Box Plot Maker to inspect distributions. For time series and comparisons, the Line Graph Maker and Bar Chart Maker are practical starting points.
Data Analysis Dashboard Design: Layout and Reading Order
Think of the screen as a sequence of questions. Put purpose and reporting period at the top, then the few KPIs that reveal whether performance is on track. Below them, show trends over time; next, the comparisons needed to locate a problem; finally, the supporting rows and notes. Reserve the most visible space for information that changes a decision, not a logo or decorative gauge.
Dashboard question and active filters Purpose · period · updated timeKPI 1Actual + targetKPI 2Trend vs priorKPI 3Quality checkMain trendWhat changed and when?Segments
Where did it change?Detail table and source notes What needs verification?
Suggested layout: the hierarchy follows an analytical task. It is a wireframe, not a requirement to use a particular number of columns.
Desktop dashboards can place trends and comparisons side by side. On mobile, stack them in order of priority; put the selected period and key KPIs first, keep axes readable and allow detail tables to scroll rather than shrinking every column to illegibility. Preserve keyboard access and text labels. Never use red and green as the only way to communicate good or bad results. Use consistent formatting and meaningful precision: “3.8%” is often easier to scan than “3.804878%.”
Filters, Drill-Downs and Dashboard Interactivity
Useful filters answer questions the audience will actually ask. A date selector changes the period; a region selector narrows results; a product category helps locate the issue. A dozen controls are not automatically better than three. If a filter applies only to some panels, say so beside the control.
Filter state must be visible. If a chart shows West but a KPI shows all regions, a user could compare unrelated numbers. Set clear defaults and provide a reset action. The synthetic dashboard above uses a single region filter and updates the headline revenue, month-over-month comparison, trend, regional bar view and category totals together. Its “Reset filter” button returns the display to all regions.
Drill-down takes a user from a category to more granular levels in the same view, such as region → city. Drill-through opens a linked detail page or report. Tooltips can provide definitions and precise values, but should not be the only place to find essential information. Interactivity is useful only when it reduces the effort needed to answer a question.
Does a Dashboard Need Real-Time Data?
No. A real-time data dashboard is useful when people can act within minutes: fraud alerts, dispatch queues or production faults are plausible cases. A quarterly margin dashboard does not become better merely by refreshing every second. Match refresh cadence to how quickly decisions can reasonably be made, how often the source changes and the cost of updating it.
| Decision | Possible refresh cadence | Reason |
|---|---|---|
| Respond to active service incidents | Minutes or near-real time | Delay can change the response |
| Review yesterday's store sales | Daily after close | Stable end-of-day numbers |
| Evaluate marketing channel results | Daily or weekly | Time for data to settle |
| Review annual research findings | On publication/update | Data changes infrequently |
Display last successfully refreshed rather than merely “last attempted.” Label the reporting period and timezone—for example, “September 1–30, 2026 · UTC; updated October 1.” Global operations need an agreed rule for when each “day” begins. If an upstream feed fails, show a stale-data warning rather than silently reusing old figures as if they were current.
Data Quality, Metric Definitions and Dashboard Validation
A well-arranged dashboard with incorrect totals is worse than a plain table whose numbers are right. Before design, inspect field types, missing values, duplicates, date parsing, unexpected categories and unusual records. AmriData's data cleaning tools can help prepare a dataset. For a systematic examination, follow the exploratory data analysis steps before deciding which measures should become routine dashboard outputs.
Know what one row represents
A row could be a customer, transaction, line item, visit or daily summary. Joining an order table to order items may repeat the order's total across multiple line items. COUNT(rows) is not the same as COUNT(DISTINCT customer_id). Recompute aggregates at the intended grain before combining data sources.
Missing values are not zeros
Zero revenue means the source indicates no revenue. Missing revenue means no trustworthy value is available. An empty filter result means the selected scope has no matching records, not that every KPI is necessarily zero. Use an explicit “No data for selected filters” message. For an API or refresh failure, show an error and the most recent valid refresh timestamp.
Reconcile totals with the source
- Pick a fixed period with known source records and timezone.
- Calculate the headline total independently using the documented formula.
- Verify that region, channel and category partitions each add back to that total when their categories are mutually exclusive and complete.
- Check that percentage denominators remain consistent after filtering and that overall rates are recomputed from counts, not averaged from displayed rates.
- Test a missing-data case, a zero-baseline case, a partial-period case and an empty filter before publishing.
Track the metric's source, transformation rules and owner—its data lineage. If the same measure appears in a weekly report and a dashboard, both should use the same definition. When they disagree, investigate rather than adjusting the chart until it looks plausible.
How to Build a Data Analysis Dashboard Step by Step
- Define the decision. Write a one-sentence goal such as “Help the ecommerce manager see whether monthly revenue is on plan and identify the largest segment deviation.”
- Identify the audience and frequency. Decide who checks the dashboard, what they already know and how soon they can act.
- Choose KPIs and supporting metrics. Keep only measures relevant to the decision; write formulas, targets and owners.
- Verify source tables and grain. Confirm date fields, unique IDs, data availability, timezone and whether joins can duplicate records.
- Clean and profile the data. Inspect nulls, duplicates, types and anomalies before trusting any visual.
- Sketch a wireframe. Put purpose and active filters above the KPIs, trend, comparisons and details.
- Select the charts. Match line, bar, histogram, scatter, heatmap or table to the analytical task.
- Add only useful interactivity. Include necessary date/region/channel filters; keep the scope visible and consistent.
- Add interpretation context. Display periods, target values, units, refresh time and concise notes about unusual events.
- Validate the calculations. Reconcile source totals and recheck weighted rates, partial periods and zero denominators.
- Test with intended users. Ask someone to answer the original question without coaching. If they cannot, simplify or change the design.
- Maintain the dashboard. Assign responsibility for refresh failures, metric definitions, new categories and changes in business questions.
Data Analysis Dashboard Example: An Ecommerce Manager
Here is the numerical logic behind the interactive example near the top of the page. All figures are synthetic illustrations, not AmriData customer information or live business performance. The sample compares two complete months, August and September 2026, under the same revenue definition.
| September measure | Value | How to read it |
|---|---|---|
| Revenue | $248,300 | $1,700 below the $250,000 goal |
| Revenue vs August | −$18,700 (−7.0%) | August revenue: $267,000 |
| Orders | 3,120 | Eligible completed orders |
| Average order value | $79.58 | $248,300 ÷ 3,120, rounded |
| Session conversion rate | 3.8% | 3,116 converting sessions ÷ 82,000 eligible sessions |
| Refund order rate | 4.2% | 131 refunded eligible orders ÷ 3,120 eligible orders |
The conversion figure uses converting sessions, not order count, because a session can contain more than one order. Likewise, the refund rate is a simplified same-cohort illustration; an actual store must define how late refunds are assigned to the order period.
Region comparison: a clear next step
| Region | August | September | Difference |
|---|---|---|---|
| West | $80,000 | $58,500 | −$21,500 |
| East | $70,900 | $74,400 | +$3,500 |
| Central | $62,000 | $62,600 | +$600 |
| South | $54,100 | $52,800 | −$1,300 |
| Total | $267,000 | $248,300 | −$18,700 |
The West region alone lost $21,500, while East and Central recovered part of that decline. In the sample category totals, Category B is down $17,600 across all regions. That prompts a more specific question: did West's drop come mostly from Category B? The dashboard's region filter exposes a category breakdown, but inventory availability, discounting and customer behavior must be checked separately before anyone claims a cause.
A traceable category breakdown
| Category | August | September | Change |
|---|---|---|---|
| A | $102,000 | $100,800 | −$1,200 |
| B | $87,000 | $69,400 | −$17,600 |
| C | $78,000 | $78,100 | +$100 |
| Total | $267,000 | $248,300 | −$18,700 |
In a production dashboard, a product detail table would add SKU, category, revenue, order count, refund rate and comparable-period change. Allow sorting and a link to inspect the relevant transactions. This is where an apparently simple red KPI becomes a useful investigation.
Other Data Analysis Dashboard Examples
The right design changes with the person making the decision. These examples name an audience, question and the kinds of data that would help.
| Use case | Decision the dashboard supports | Likely views |
|---|---|---|
| Marketing | Which campaign or channel merits budget review? | Qualified leads, spend, conversion rate, channel trends |
| Sales | Where is pipeline coverage or win rate weakening? | Pipeline by stage, period trends, rep/region comparisons |
| Finance | Are costs and cash movements tracking the plan? | Budget variance, cash trends, category details |
| Customer support | Which issue queues risk breaching response goals? | Backlog, aging distribution, resolution time, priority mix |
| Operations | Which step is delaying fulfillment? | Delay counts, throughput, defects, shift comparison |
| Web analytics | Which page or channel needs investigation? | Engaged sessions, conversions, device and landing-page splits |
| Research | Are groups or study waves comparable? | Sample sizes, missingness, distributions, group summaries |
In a research dashboard, missing values and uncertainty may be more important than targets. In an operational dashboard, timestamps and clear exception lists may matter more than quarterly trends. The general rule remains the same: design around the decision.
Data Analysis Dashboard Tools: Excel, Power BI, Tableau and Others
You can build a data dashboard with a spreadsheet, a business intelligence product or a custom application. There is no universal best choice. Decide based on source connections, dataset size, refresh needs, sharing permissions, accessibility, maintenance costs and the skill of the people who will own it.
| Approach | Practical fit | Trade-off to consider |
|---|---|---|
| Excel | Known datasets, pivots, charts and slicers | Refresh, version control and sharing can require care |
| Google Sheets | Collaborative lightweight tracking | Complex data modeling or high volume may be awkward |
| Power BI | Modeled business data and interactive reports | Product terminology, sharing permissions and licenses |
| Tableau | Interactive visual exploration and dashboards | Model governance, deployment and licensing |
| Looker Studio | Browser-based dashboards using connected sources | Connector quality, query and data access limitations |
| Custom web application | Specialized or embedded workflows | Engineering, accessibility, security and maintenance |
One terminology point matters: in Power BI, the dashboard is a particular single-page feature in the Power BI service; most slicers and rich drill-down interactions are in reports. A general dashboard design guide can use the word more broadly, but a software tutorial should respect the product's terminology. See the Microsoft Power BI dashboard documentation and Tableau's dashboard design guidance.
How AmriData Fits Into a Dashboard Workflow
Before any dashboard can be trusted, its dataset has to be understandable. AmriData currently supports a connected workflow for uploading tabular files, reviewing their structure, checking data quality, creating charts and KPI-style views, saving charts, asking dataset-aware AI questions and preparing reports. Those steps help create reliable inputs and evidence for dashboard decisions.
Important product distinction: AmriData's public pricing material currently lists full dashboards among future Pro functionality. Its existing workspace Dashboard is an account overview; that is not the same as a published, configurable analytics dashboard builder. The interactive ecommerce example in this article is independent, synthetic teaching code. It is not a feature being advertised as live.

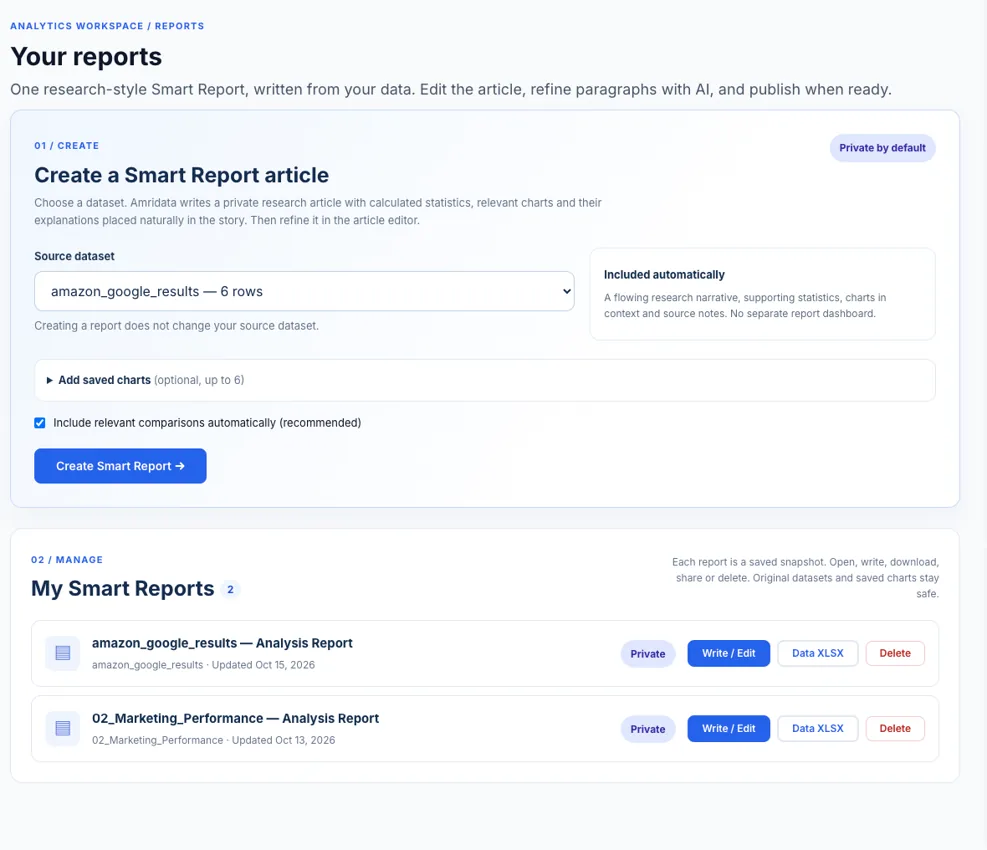
You can begin with dataset profiling and descriptive analysis, use AmriData's data visualization features to make relevant charts, then examine the results with AI Data Chat. Confirm any suggested explanation against the source data. See all current features or the free tools library for individual graphs and statistics.
Common Dashboard Mistakes and Their Fixes
| Mistake | Why it causes trouble | Better approach |
|---|---|---|
| Putting every metric on top | The decision gets buried | Prioritize KPIs tied to the user's objective |
| Mixing filters or time periods | Numbers no longer describe the same population | Show filter scope and compare like-for-like periods |
| Hiding the last refresh | Old values look current | Display last success, period and timezone |
| Calling missing values zero | False stability or decline | Use explicit no-data and error states |
| Averaging subgroup rates | Can weight small and large groups equally | Recalculate from the underlying counts |
| Using a truncated bar scale | Exaggerates category differences | Start quantitative bar axes at zero |
| Suggesting causality from trend | Overstates what descriptive data prove | Use the trend to form a testable hypothesis |
| No owner for metric changes | Definitions drift between teams | Document formulas, lineage and responsibility |
For the wider set of chart-level problems, including confusing encodings and scales, see common data visualization mistakes.
Data Analysis Dashboard Checklist Before Publishing
- The primary audience and decision are written clearly above the dashboard.
- Every headline KPI has a documented formula, denominator, period and owner.
- Category/segment totals reconcile to the same headline total.
- Partial periods, seasonality and percentage-point differences are handled accurately.
- The last successful refresh, reporting window and timezone are visible.
- Every visible chart follows the active filter or explicitly states a different scope.
- Missing data, zero, loading, error and no-result states have distinct messages.
- The chart style matches the analytical question; axes, units and labels are legible.
- Color is not the only status indicator; keyboard access and mobile layout are tested.
- A real user can identify where to investigate next without guessing the chart's meaning.
Frequently Asked Questions About Data Analysis Dashboards
What is a data analysis dashboard?
It is a visual decision-support view that combines selected KPIs, trends, comparisons and details for a defined audience and purpose. It should help users monitor outcomes and investigate changes, not merely display a large number of charts.
What should a data dashboard include?
Usually a clear title and period, a few defined KPIs, relevant trend and comparison charts, visible filters, supporting details, targets where useful and a last-refreshed timestamp. Remove anything that does not help answer the intended question.
How do I create a data analysis dashboard?
Define the audience and decision, document KPI calculations, validate and clean source data, sketch a hierarchy, choose charts, add useful filters, reconcile totals and test the view with its intended users. Maintain it as definitions or data sources change.
What is the difference between a KPI and a metric?
A metric is any measure. A KPI is a measure tied directly to an objective or performance target. A dashboard can use many supporting metrics without making all of them headline KPIs.
How many KPIs should a dashboard show?
There is no universal number. Start with the few measures a user needs for the core decision, often three to six in a summary row, and keep supporting measures further down or in drill-down views.
Is a dashboard the same as a report?
No. Dashboards generally emphasize recurring monitoring and exploration; reports allow more detailed narrative, methods and explanation. Depending on the software, both can contain charts and both can be interactive.
Which charts are best for an analytics dashboard?
Line charts for trends, bars for category comparisons, scatter plots for relationships, histograms or box plots for distributions and tables for precise records. Choose according to the question, not appearance.
Do dashboards have to update in real time?
No. Real-time refresh is useful only when the source changes and people can respond quickly. Daily, weekly and manually refreshed dashboards can be more appropriate for other decisions.
What is drill-down in a dashboard?
Drill-down means moving from a summary to more granular data, such as country to region to city. Drill-through typically opens a related detail page or report. Not every dashboard needs either interaction.
Can I create a data analysis dashboard in Excel?
Yes. Tables, PivotTables, charts and slicers can support useful spreadsheet dashboards. Confirm the workbook's data-refresh process and who maintains definitions and shared versions.
Can AI create an accurate dashboard automatically?
AI may suggest charts, draft layouts or help summarize data, but it cannot guarantee correct KPI definitions, clean data or valid causal interpretation. Reconcile the calculations and review its conclusions before acting.
Can I build a complete interactive dashboard in AmriData today?
AmriData currently offers dataset analysis, saved charts, KPI-style visualizations, AI-assisted explanation and Smart Reports. Its public site still presents a full dashboard builder as future functionality. Use the available features to inspect the data and prepare reliable visual evidence; check the live feature page for changes.
Key Takeaways
A good data analysis dashboard is not a screen full of charts. It is a view built for a particular audience and decision. Start with the question, select a small set of defined KPIs, compare appropriate periods, choose visuals that make differences readable and show the active filters and data freshness. Finally, test every headline figure against the source. A dashboard earns its space when it helps someone move from “What changed?” to “What should we check next?” without mistaking a pattern for an explanation.
Related Data Visualization Guides and Tools
- Data Visualization guides — the main category for chart design and interpretation.
- Data Analysis guides — methods and preparation before you present results.
- How to Choose the Right Chart Type — detailed visual selection for trends, comparisons and distributions.
- Exploratory Data Analysis Steps — inspect problems in the dataset before creating KPIs.
- Data Visualization Mistakes — common choices that confuse or mislead readers.
- Column Chart Maker — create comparisons when a vertical layout fits the categories.
References and Further Reading
- Tableau Help — Best Practices for Effective Dashboards. Audience, purpose and visual hierarchy.
- Tableau — What Is a Dashboard?. Dashboard uses, workflow and examples.
- Microsoft Learn — Introduction to Dashboards for Power BI Designers. Important product-specific distinction between reports and dashboard tiles.
- AmriData — Data Visualization Features. Current chart types, saving and export features.