
To handle missing data, identify absent values, measure missingness by variable, investigate why values are missing, and choose a treatment that fits your analysis. You may retain gaps, recover records, exclude selected cases or impute estimates. Check how the decision changes the results before reporting them.
This tutorial belongs to our Data Analysis guides. Follow one eight-order example through counting, deletion, imputation, Excel and Python. The zero-dollar order stays zero throughout.
How to handle missing data: quick answer
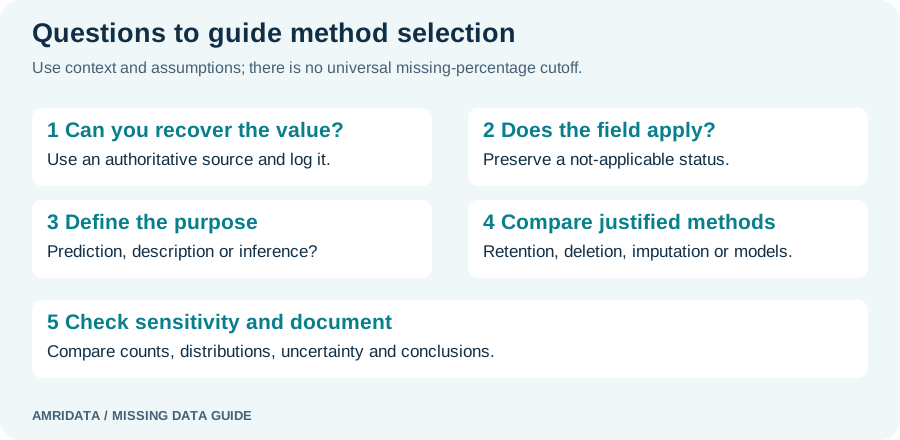
Start by preserving the original dataset and identifying what each blank or missing-value code means. Count missing observations by variable, then compare missingness across relevant groups and dates. Choose whether to recover values, retain gaps, exclude records or estimate replacements based on the question and defensible assumptions. Deleting incomplete rows can change who remains in the analysis; simple imputation can reduce variability. For statistical inference, consider methods that account for uncertainty in missing values. For prediction, fit preprocessing on training data only. Compare plausible treatments, record changes and report the remaining limitations alongside your findings.
| Step | Action | Purpose |
|---|---|---|
| 1 | Preserve the original | Keep an audit trail and a recoverable source |
| 2 | Identify missing values | Separate unknown, not applicable and recorded zero |
| 3 | Calculate missingness | Count gaps by column and affected rows |
| 4 | Investigate patterns | Check groups, dates and collection procedures |
| 5 | Choose a method | Match treatment to the analytical question |
| 6 | Apply and validate | Check counts, types and unchanged observations |
| 7 | Compare and document | Assess sensitivity and record assumptions |
Choose a treatment before filling cells
| Situation | Method to consider | Main caution |
|---|---|---|
| Authoritative records contain the value | Recover it with provenance | Confirm the same record, period and unit |
| Field does not apply | Retain a not-applicable status | Do not invent a measurement |
| Only an observed summary is needed | Keep gaps; report available count | The observed group may be selective |
| Complete-case assumptions are defensible | Exclude cases incomplete for required fields | Check precision and subgroup losses |
| Predictors need numeric inputs | Test a simple imputation baseline | Learn fill values within training folds |
| Inference depends on incomplete variables | Multiple imputation or an appropriate likelihood model | Model assumptions and uncertainty matter |
| A time series has gaps | A process-appropriate temporal method | Avoid future information in forecasts |
| Unrecorded values may drive missingness | Sensitivity analysis and specialized models | Ordinary filling does not resolve MNAR |
The AmriData Data Cleaning page describes the cleaning workspace. Choose your statistical rule first, then inspect the available controls. A cleaning interface cannot establish a missingness mechanism or make an unsuitable treatment valid.
Open the CSV Data CleanerWorked example: eight orders with five missing cells
This synthetic example was created for education. “Missing” means an unrecorded measurement; the downloadable CSV represents those cells as empty fields. Order ID is an identifier, not a quantitative measurement. Keep its leading zeros when importing.
| Order ID | Region | Order value ($) | Delivery days | Satisfaction (1–5) |
|---|---|---|---|---|
| 001 | North | 120 | 2 | 5 |
| 002 | South | 80 | Missing | 4 |
| 003 | North | Missing | 4 | 3 |
| 004 | West | 200 | 6 | Missing |
| 005 | South | 100 | 3 | 4 |
| 006 | West | 0 | 5 | 2 |
| 007 | North | 150 | Missing | 5 |
| 008 | South | 90 | 4 | Missing |
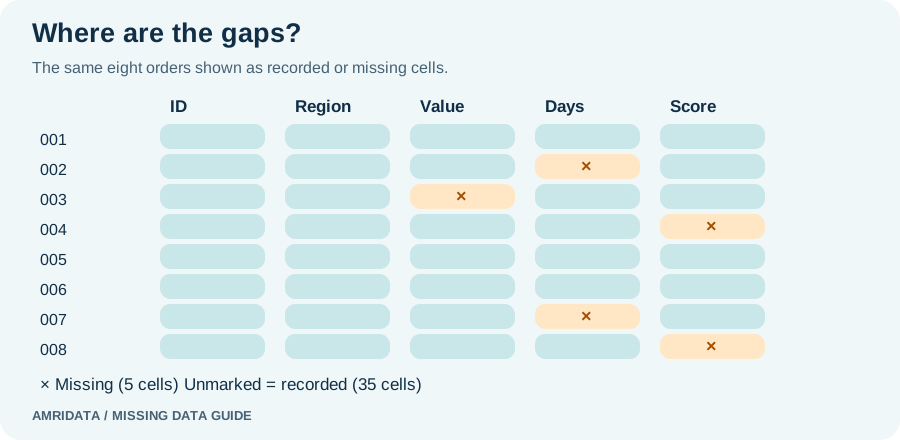
There are 8 records, 5 columns and 40 cells. Five cells are missing, spread across five different records. Only orders 001, 005 and 006 have every field recorded. Order 006 has a valid recorded value of $0; it is not one of the gaps.
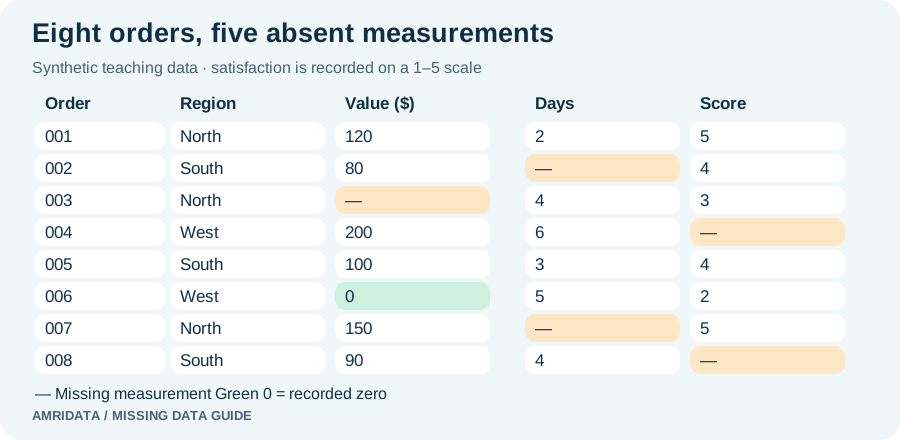
The seven observed order values total $740. Their mean is $740 ÷ 7 ≈ $105.71 and their median is $100. Observed delivery times are 2, 4, 6, 3, 5 and 4 days, with both mean and median equal to 4. These summaries describe recorded values; they do not recover the absent measurements.
For file delimiters, encoding and the broader import workflow, see how to clean CSV data. Here we focus on the choice and consequences of missing-value treatments.
What is missing data?
Missing data occur when a value relevant to an observation or analysis has not been recorded. A customer may skip a survey question, a system may fail to store a measurement, or a delivery may not yet have happened. Those explanations lead to different decisions. Ask the data owner what the field means before changing it.
| Recorded status | Meaning | Practical response |
|---|---|---|
| Unknown or withheld | Applicable value exists but is unavailable | Investigate collection and nonresponse |
| Not collected | The field was absent from collection | Check coverage by source or period |
| Not applicable | The question does not apply | Keep a separate applicability status |
| Not yet observed | The event or follow-up is incomplete | Respect the reporting cutoff |
| System unavailable | Recording failed | Check logs and affected groups |
| Censored observation | A bound or partial outcome is known | Use that information in a suitable model |
A blank spouse-name field for an unmarried respondent should not be filled with a typical name. A delivery still in progress has a duration longer than the time already elapsed; treating it as an ordinary unknown completed duration throws away information. Truncation differs again: some units never enter the recorded sample, so a cell count cannot reveal them.
Missing markers include NULL, NaN, None, empty strings, whitespace, N/A and source-defined sentinels such as −999. Their meaning is field-specific: NA can be a legitimate region code. Define accepted tokens, units, types and permissible treatments in a data dictionary. The Data Dictionary Generator is a related tool; metadata does not prove MCAR, MAR or MNAR.
Identify and measure missing values
Profile the raw import before converting types. Inspect whitespace-only fields and documented placeholders separately from software nulls. A numeric-looking string is a type problem, not necessarily a missing measurement. Failed parsing should produce a review list rather than silently turning valid entries into gaps. Preserve the original cell and the reason for any conversion.
| Variable | Missing | Records | Missing % |
|---|---|---|---|
| Order ID | 0 | 8 | 0% |
| Region | 0 | 8 | 0% |
| Order value | 1 | 8 | 12.5% |
| Delivery days | 2 | 8 | 25% |
| Satisfaction | 2 | 8 | 25% |
For a column, missing percentage = missing applicable observations ÷ relevant records × 100. Here all eight records are relevant to each field. Overall cell missingness is 5 ÷ 40 = 12.5%, while the fraction of records with any gap is 5 ÷ 8 = 62.5%. These denominators answer different questions. Among the three measurement columns alone, 5 of 24 cells are missing, or about 20.83%.

For conditional questions, report applicability separately. If a follow-up question applies to 20 of 100 respondents and 4 eligible people skip it, the response-missing rate is 4 ÷ 20 = 20%. Counting all 80 ineligible respondents as missing mixes questionnaire design with nonresponse.
Examine missingness patterns
Compare missingness by region, collection date, device, survey position and source system. In this example, satisfaction is absent for one of two West orders and one of three South orders, but for none of three North orders. Those tiny counts suggest questions to investigate; they do not support a reliable regional explanation.
A missingness heatmap shows which fields disappear together. A subgroup bar chart shows unequal coverage. Check whether failures cluster around a software release or survey dropout point. These checks belong within exploratory data analysis. Scattered gaps on a plot are not evidence that the process was random.
MCAR vs MAR vs MNAR
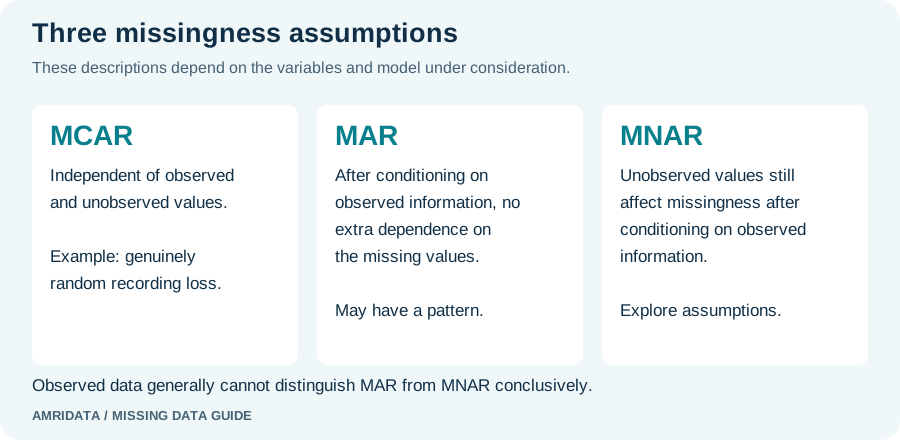
These terms describe assumptions about the missingness process relative to the available variables and statistical model. A dataset can contain several causes of missingness. Investigate each affected field and their joint pattern rather than assigning one label from a visual inspection.
| Mechanism | Meaning | Illustration | Limitation |
|---|---|---|---|
| MCAR | Missingness is independent of observed and unobserved values | A genuinely random recording failure | An outage affecting one group is not automatically MCAR |
| MAR | Conditional on observed information, missingness does not additionally depend on missing values | Income nonresponse depends on fully recorded age | Age-related patterns alone do not prove MAR |
| MNAR | Missingness still depends on unobserved values after conditioning on observed information | Higher income itself discourages disclosure | Requires explicit assumptions and sensitivity checks |
MAR does not mean “no pattern.” Younger respondents could omit income more often, while income is unrelated to response within each recorded age group. That would be compatible with MAR given age. If, within age groups, the highest earners still withhold income more often because of its amount, the mechanism could be MNAR. Adding useful observed auxiliary information can change which assumption is plausible.
Observed data may contradict MCAR, but generally cannot settle MAR versus MNAR. Collection records and subject knowledge matter. Little’s MCAR test assesses compatibility under its model assumptions; a nonsignificant result does not prove MCAR, and rejection does not establish MAR. See the statistical references for methodological background.
Leave gaps, delete records or remove columns?
Leave values missing when the analysis permits it
An observed mean can use seven order values without filling the eighth. Label it “mean among seven recorded orders,” and show one missing value. If high-value orders are disproportionately absent, that mean may misrepresent all orders. Software accepting missing values does not establish that an estimate answers your intended question.
Complete-case or listwise deletion
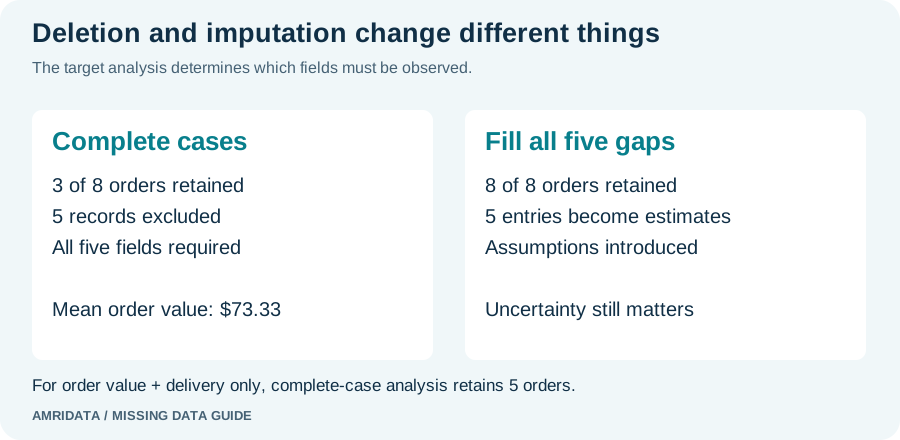
Complete-case analysis retains records observed on every variable required for that analysis. Using all five example fields leaves three orders, discarding 62.5% of records. Their mean order value is (120 + 100 + 0) ÷ 3 = $73.33. This differs from $105.71 partly because different orders remain; neither calculation reveals the true eight-order mean.
If the analysis uses only order value and delivery days, orders 001, 004, 005, 006 and 008 remain: five cases, not three. Missing satisfaction is irrelevant to that particular calculation. MCAR can justify complete-case analysis; some estimands and models permit validity under narrower conditions beyond MCAR. State the condition, assess sample loss and avoid claiming a small missing percentage guarantees safety. Hughes and colleagues discuss these distinctions in their methodological paper.
Pairwise deletion and removing columns
Pairwise deletion uses the available pair for each statistic. Two correlations can therefore describe different groups. Report each pair’s sample size and avoid treating the resulting matrix as if it came from one complete sample: it may not be positive semidefinite, which can break later analyses. Removing a column is reasonable when it is unnecessary or unusable for the question, but a percentage threshold alone does not justify losing an essential variable.
Simple missing-data imputation methods
Imputation supplies an estimated or justified replacement for a missing entry. Preserve a flag before filling so you can identify every estimate later. Use one method per field only after checking its measurement scale and purpose; a whole-table fill can corrupt IDs, dates and categories.
| Method | Possible use | What can go wrong | Check |
|---|---|---|---|
| Constant or unknown category | A meaningful not-recorded predictor category | Numeric constants create artificial values | Keep unknown distinct from not applicable |
| Mean | A numeric preprocessing baseline | Shrinks spread; distorts relationships | Compare variance and correlations |
| Median | A baseline less affected by observed extremes | Still ignores missing-value uncertainty | Check predictions and subgroup effects |
| Mode | A categorical baseline | Inflates the largest category | Compare category shares |
| Group-wise fill | Observed differences between stores or regions | Tiny groups produce unstable estimates | Set training-only fallback rules |
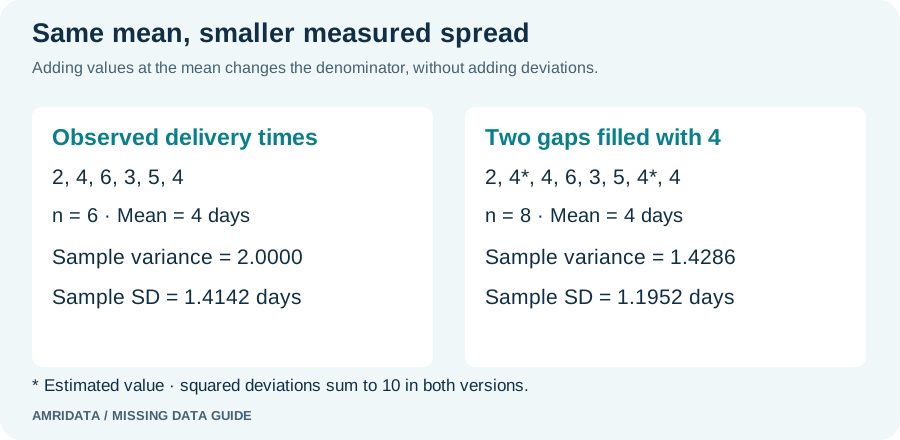
Mean filling delivery days replaces both gaps with 4, yielding 2, 4, 4, 6, 3, 5, 4, 4 in order-ID sequence. The mean stays 4, but sample variance falls from 2.00 to about 1.43 days² and sample standard deviation falls from about 1.41 to 1.20 days. Preserving a mean does not preserve uncertainty or associations.
Median filling the missing order value with $100 gives an eight-order mean of $105.00. This is a teaching scenario, not a recovered transaction. Median filling can be a useful predictive baseline with skewed inputs, but does not automatically remove selection bias. For a different list, 10, 12, 13, 100 and a gap, the observed median is 12.5, not 13.
Mode filling a skipped satisfaction answer would make the most common score more frequent. A skipped answer is not evidence of agreement. Group-wise filling can respect known differences, but the North delivery median here uses only two observed values. Such a small group is a fragile basis for estimating another order. Set a documented fallback when a group has no valid observations.
Advanced methods and imputation uncertainty
K-nearest neighbors imputation estimates entries from similar records. Its usefulness depends on distance definitions, feature scaling, eligible predictors and computational cost. Currency can dominate distance if units are ignored. Compare it against a simple baseline on appropriate validation data; greater complexity does not establish better results. scikit-learn’s imputation documentation describes SimpleImputer, KNNImputer and related options.
Regression imputation predicts missing values from observed fields. Deterministic predictions tend to be too smooth when treated as complete observations. A misspecified model can reinforce a false relationship. Preserve realistic bounds and categories, and distinguish predicting a plausible input from producing valid uncertainty for a downstream coefficient.
Multiple imputation generates several plausible completed datasets, analyzes each and pools estimates and uncertainty, commonly using Rubin’s rules. This incorporates within-imputation and between-imputation variation under suitable assumptions. Repeating the same mean fill several times is not multiple imputation. The UCLA multiple-imputation seminar explains this workflow.
Specify predictors, variable types, interactions and auxiliary information consistently with the analysis. Common implementations assume MAR; suitable models, enough imputations and diagnostic checks remain necessary. Do not average the completed datasets first and analyze that average as observed data. An iterative imputer run once also does not automatically provide pooled inference.
Some models can use full-information maximum likelihood to analyze incomplete observations without making one filled table. Inverse probability weighting instead weights observed cases by estimated observation probabilities, requiring suitable models and sufficient overlap. Neither is a universal fix for MNAR. Consequential inferential work may need statistical advice on the estimand, collection process and sensitivity model.
Missing data in time series
Sort by a reliable timestamp and separate entities before any temporal fill. Forward fill carries the most recent value forward; it can suit a recorded state that persists until changed. It can also invent persistence in sales or sensor readings. Set a gap limit justified by the process, and leave long outages visible.
Backward fill uses a later observation. Interpolation estimates between observed endpoints, often assuming linear change or time-based spacing. Both can be useful for retrospective reconstruction, but future endpoints are unavailable at the moment a real-time forecast is made. Never interpolate across unrelated customers or treat row order as elapsed time. Document the sampling interval, longest gap and availability cutoff.
How to handle missing data in Excel
Import the example with Order ID as text, Region in B, Order Value in C, Delivery Days in D and Satisfaction in E. Put headers in row 1 and eight observations in rows 2–9. Leave missing cells genuinely empty. Keep a raw sheet, then create a separate working sheet so the original values remain recoverable.
| Task | Formula | Expected result |
|---|---|---|
| Count missing order values | =COUNTBLANK(C2:C9) | 1 |
| Missing order-value fraction | =COUNTBLANK(C2:C9)/ROWS(C2:C9) | 12.5% when formatted as Percentage |
| Observed mean | =AVERAGE(C2:C9) | 105.7142857 |
| Observed median | =MEDIAN(C2:C9) | 100 |
| Row has a blank | =COUNTBLANK(A2:E2)>0 | Fill down; five TRUE results |
| Delivery sample SD | =STDEV.S(D2:D9) | 1.4142136 |
COUNTBLANK includes formulas returning empty text and excludes numeric zero. It does not treat a space or literal NA text as blank. Count a documented text token separately with COUNTIF, and inspect actual Excel errors. Use filters to review blanks; Go To Special → Blanks selects genuinely empty cells rather than every visually empty result. Formulas shown use English function names and comma separators. See Microsoft’s COUNTBLANK reference.
For a reversible median-fill demonstration, put =MEDIAN(C2:C9) in H2. In F2 enter =IF(C2="",$H$2,C2) and fill down to F9. In G2 enter =C2="" and fill down to preserve the missing flag. The recorded zero remains zero. This formula assumes the source contains valid numbers or blank/empty-text cells; resolve placeholders, spaces and errors first. Freeze a copy of the output only after checking it against the raw sheet.
In Power Query, import through From Table/Range, inspect types and nulls, and review Column quality. Profiling may cover only a preview subset, so select the entire dataset where available. Apply a deliberate replacement or row-removal step, compare counts, then Close & Load to a separate output. Interface availability varies by Excel platform. These transformations do not implement statistical multiple imputation. For broader preparation, see clean data in Excel.
How to handle missing data with Python and pandas
The package includes orders.csv and a runnable script. Run it from the examples folder. This import treats only empty fields as missing and preserves leading-zero IDs; it deliberately disables default token inference. For your source, add only field-specific missing markers that the data dictionary authorizes. Unexpected strings in a numeric column raise an error instead of being silently discarded.
import pandas as pd

raw = pd.read_csv("orders.csv", dtype="string", keep_default_na=False)
df = raw.copy()
for col in ["order_value", "delivery_days", "satisfaction"]:
    text = raw[col].str.strip().replace("", pd.NA)
    df[col] = pd.to_numeric(text, errors="raise").astype("float64")

print(df.isna().sum())
print(df.isna().mean().mul(100))
print("Affected rows:", df.isna().any(axis=1).sum())
print("Missing cells:", df.isna().sum().sum())

complete = df.dropna(subset=["order_value", "delivery_days"])
filled = df.copy()
filled["order_value_was_missing"] = df["order_value"].isna()
filled["order_value"] = df["order_value"].fillna(df["order_value"].median())
print("Selective complete cases:", len(complete))
print("Original / filled mean:", df["order_value"].mean(),
      filled["order_value"].mean())
isna identifies recognized missing entries; it does not automatically flag arbitrary strings. dropna with the selected two-column subset leaves five rows, including records with absent satisfaction. fillna changes only the specified order-value column. The flag is created before replacement. The pandas missing-data guide explains how missing values interact with data types and calculations.
Before exporting, compare row IDs, missing counts and the originally observed cells. Check that order 006 remains zero and that only order 003 receives $100. If every value in a field is absent, its observed median is undefined; stop and choose a justified external source, model or exclusion rather than assuming the operation repaired it.
Missing data in machine learning: prevent leakage
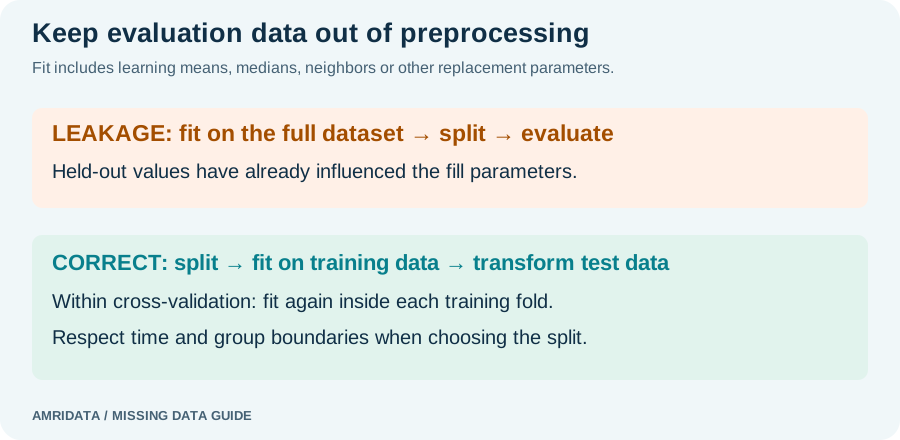
Split data before learning any imputation parameters. Fit the imputer on training observations, then transform validation or test data using those fitted parameters. During cross-validation, preprocessing must be fitted again inside each training fold. A pipeline helps enforce that boundary. A random split is appropriate only when the sampling design supports it; related customers and time-ordered forecasts need suitable group or temporal splits.
from sklearn.impute import SimpleImputer
from sklearn.linear_model import Ridge
from sklearn.model_selection import train_test_split
from sklearn.pipeline import make_pipeline

# Tiny teaching example only: no credible performance claim.
labeled = df.dropna(subset=["satisfaction"])
X = labeled[["order_value", "delivery_days"]]
y = labeled["satisfaction"]
X_train, X_test, y_train, y_test = train_test_split(
    X, y, test_size=2, random_state=42
)
model = make_pipeline(
    SimpleImputer(strategy="median", add_indicator=True),
    Ridge(alpha=1.0)
)
model.fit(X_train, y_train)
predictions = model.predict(X_test)
print(predictions)
This six-labeled-record example demonstrates execution order, not a validated satisfaction model; Ridge also does not constrain predictions to the 1–5 scale. Use a suitable outcome model and adequate data in practice. Keep unknown targets out of ordinary supervised evaluation. Acquire labels or use explicitly designed semi-supervised methods rather than scoring against invented answers.
A missing indicator records absence and may help prediction when the collection process carries information. It does not prove a mechanism or guarantee unbiased causal inference. Compare validation performance, subgroup errors and stability across plausible methods, then evaluate the chosen pipeline once on untouched test data. Artificially masking observed cells can test reconstruction, but its simulated missingness may differ from real gaps. See scikit-learn’s leakage guidance.
Compare statistical results and test sensitivity
| Order-value treatment | Included values | Mean ($) | Interpretation |
|---|---|---|---|
| Observed values only | 7 | 105.71 | Summary of recorded amounts |
| Complete cases across all five fields | 3 | 73.33 | Different selected subset |
| Fill missing value with observed median | 8 | 105.00 | One estimate of $100 |
| Fill missing value with observed mean | 8 | 105.71 | Same mean; extra uncertainty remains |
| Assume missing amount was $0 | 8 | 92.50 | Hypothetical low-value scenario |
| Assume missing amount was $200 | 8 | 117.50 | Hypothetical high-value scenario |
The last two rows are sensitivity scenarios, not recommended replacements or guaranteed bounds. They use (740 + assumed value) ÷ 8. If a business decision requires average order value above $110, the unknown order would need to exceed $140 to cross that threshold. Whether such an amount is plausible must come from source knowledge; this calculation cannot recover it.
Check the same units, eligible population and analysis period across treatments. Compare distributions, category shares, correlations, subgroup representation and uncertainty, not just the overall mean. Review descriptive statistics and standard deviation when interpreting changes. For MNAR concerns, domain-informed shifts, pattern-mixture or selection models can explore how assumptions affect conclusions.
Common missing-data mistakes
| Mistake | Why it matters | Better approach |
|---|---|---|
| Replace every gap with zero | Changes the measurement meaning | Preserve valid zeros; investigate unknowns |
| Delete every incomplete row | Loses usable cases and changes groups | Define required analysis variables |
| Use a universal 10% or 30% cutoff | Ignores mechanism and importance | Justify decisions for the actual question |
| Mean-fill every numeric field | Changes spread and relationships | Choose and evaluate by field and purpose |
| Treat imputed values as observed | Hides uncertainty | Keep flags and report estimates |
| Declare MAR from a plot or test | Observed data do not settle it | Use process knowledge and sensitivity |
| Mode-fill skipped survey answers | Invents preferences | Model nonresponse appropriately |
| Impute target labels for evaluation | Creates false ground truth | Evaluate on genuine known labels |
| Learn fill values before splitting | Leaks evaluation information | Fit inside the training pipeline |
| Use future endpoints in forecasts | Uses unavailable information | Respect prediction-time availability |
| Assume multiple imputation is always valid | Models can be wrong | Check specification and pooled inference |
| Hide deletions or change category meanings | Makes results hard to audit | Record counts, coding and sensitivity |
Document your missing-data decisions
Keep the raw source, processing code and a small decision log together. Record source version, field, applicable population, missing tokens, counts before and after, suspected cause, chosen rule, fit population and reviewer. State which comparisons were made and whether the practical conclusion changed. Record unresolved gaps as well as completed replacements.
Field: order_value (USD)
Source: synthetic orders.csv, eight records
Missing before: 1/8 (12.5%); recorded zero retained
Purpose: teaching comparison, not inferential reporting
Rule: observed median ($100), applied only to order 003
Flag: order_value_was_missing, recorded before filling
After: eight rows, zero missing order values
Sensitivity: assumed $0 / $200 gives mean $92.50 / $117.50
Limitation: original amount and missingness mechanism unknown
Frequently asked questions
How do you handle missing data without biasing results?
Recover values when possible, define the analysis and justify assumptions before choosing a method. Compare plausible treatments and report uncertainty; no automatic fill guarantees unbiased results.
Is 10% missing data acceptable, and is 30% too much?
Neither percentage settles the decision. Concentrated nonresponse in a crucial subgroup can matter at a low overall rate. Consider the estimand, remaining information, mechanism and sensitivity.
Can I prove data are MAR?
Generally not from observed values alone. MAR is a conditional assumption supported by collection knowledge and useful observed predictors; sensitivity analysis explores departures.
When should I delete rows with missing values?
When complete-case assumptions are defensible for the analysis and the remaining information is adequate. Require completeness only on fields actually used, and report exclusions.
Should I replace missing data with zero?
Only when authoritative information establishes that zero is the correct value. An unknown amount is not evidence of no activity.
What if an entire column is missing?
The column supplies no observed mean, median or relationships to learn from. Recover source data, use justified external information, or exclude it from an analysis that can proceed without it.
Does imputation affect standard deviation?
Yes. In the delivery example, adding two mean-filled values changes sample SD from about 1.41 to 1.20 days even though the mean stays at 4.
How do I handle missing categorical values?
Consider a clearly defined not-recorded category, a justified categorical imputation model or a predictive baseline. Keep structural not-applicable values distinct and check category proportions.
What do dropna and fillna do?
dropna removes rows or columns according to missingness rules. fillna replaces recognized missing entries. Neither chooses a statistically defensible rule for you.
Can AmriData help with missing data?
The CSV Data Cleaner and Data Cleaning feature pages provide cleaning entry points. Review available controls and outputs. This guide does not claim the tools implement multiple imputation or MNAR models.
What to keep in your analysis report
Knowing how to handle missing data means explaining both the treatment and its consequences. Report what was absent, why your assumptions are plausible, which values were estimated or excluded, and whether alternative assumptions change the conclusion. A completely filled table can still support a poor analysis; a transparent account of uncertainty is more useful than cosmetic completeness.
Related Data Analysis guides and tools
Sources and software references
- Hughes et al.: Accounting for missing data in statistical analyses
- Columbia University: Missing Data and Multiple Imputation
- University of Southampton: MCAR, MAR and MNAR
- UCLA: Multiple Imputation in Stata
- Microsoft: Power Query profiling
- pandas: Working with missing data
- pandas: read_csv
- pandas: fillna
- pandas: dropna
- scikit-learn: Imputation of missing values
- scikit-learn: Common pitfalls and data leakage
- Microsoft: COUNTBLANK