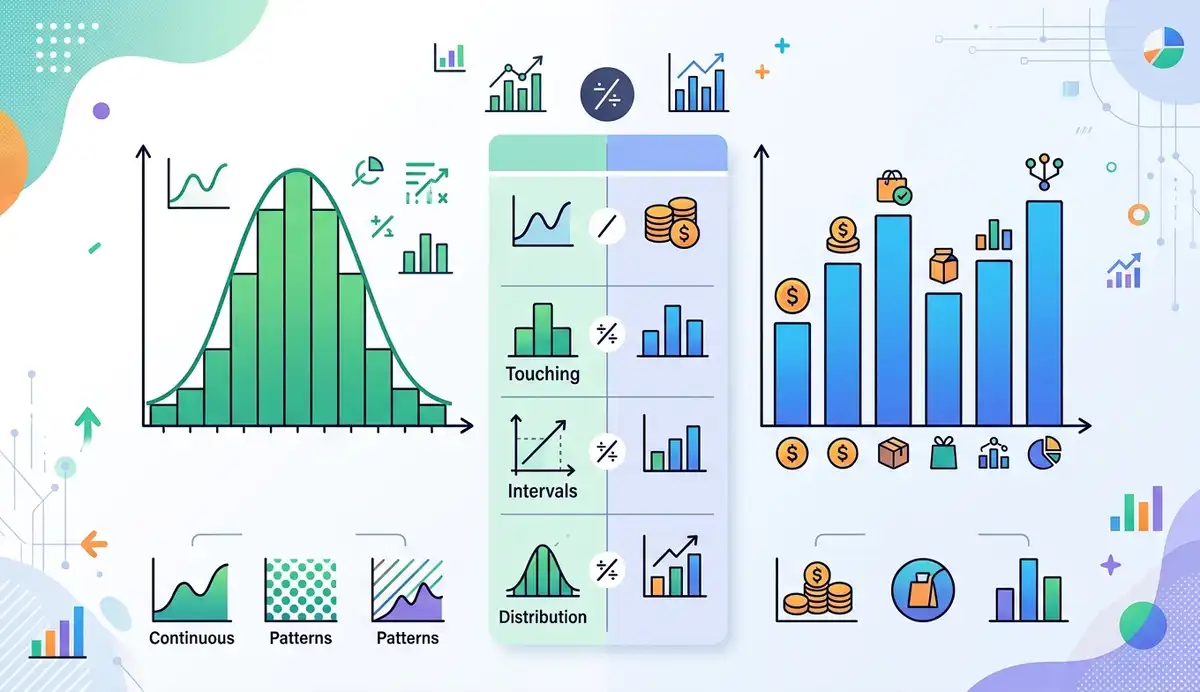
The difference between a histogram and a bar graph is the kind of data each one displays. A histogram groups numerical observations into intervals to show a distribution. A bar graph compares values across named categories. Histogram bars normally touch because the numerical intervals are adjacent; bar-graph bars usually have gaps to separate the categories. Both use rectangles, but they answer different questions. If you have a list of exam scores, think histogram. If you have a count of students choosing each fruit, think bar graph.
That distinction matters when a spreadsheet contains both types of information. A column of test scores describes measurements you can group into ranges. A column of favorite foods names categories you can count. The same rectangular shape is used in both displays; the meaning of each bar changes.
Part of AmriData’s Data Visualization guides.
Histogram vs Bar Graph: Key Differences
Look first at what the horizontal axis represents. In a histogram, it is a numerical scale split into consecutive ranges. In a bar graph, it identifies distinct groups. The spacing between bars is a useful visual clue, but not the definition.
Side-by-side comparison of a histogram and a bar graph
| Feature | Histogram | Bar graph |
|---|---|---|
| Main purpose | Show how numerical observations are distributed | Compare values among categories |
| Data | Quantitative measurements or numerical observations | Named groups with counts, percentages or numeric summaries |
| Horizontal axis | Ordered numerical intervals (bins) | Category labels |
| Vertical axis | Frequency, relative frequency or density | Count, percentage, total, average or another numeric value |
| Bar spacing | Normally touching for adjacent bins | Usually separated |
| Bar order | Fixed by numerical boundaries | May be sorted, except when categories have a meaningful order |
| Bar width | Represents the width of a numerical interval | Chosen primarily for legibility |
| What to read | Concentration, spread, gaps and possible skewness | Which group is larger, smaller or different |
One subtle point: a bar graph can show numerical values on its vertical axis. That does not make it a histogram. The issue is whether the bars stand for categories or ranges of a quantitative variable.
Histogram and Bar Graph at a Glance
- Histogram: Best for the distribution of raw numerical measurements or counts.
- Bar graph: Best for comparing distinct groups, labels, or category summaries.
- First question: Does the x-axis show a number line or separate labels?
- What matters more than gaps: The meaning and type of the underlying variable.
- Typical outputs: Histograms show bins and frequencies; bar graphs show categories and values.
What Is a Histogram?
A histogram divides a numerical scale into intervals called bins and counts how many observations fall in each one. It is useful when you want to understand a distribution rather than inspect each individual number.
Suppose you record how long ten customers waited for service. The raw numbers show exact waiting times, but a histogram can quickly reveal whether most waits were short, whether results varied widely, or whether a few unusually long waits occurred. A histogram can also show relative frequency: the share of observations in each bin. With equal-width bins, taller bars mean more observations in that interval.
The bin width is the numerical distance covered by one interval. Wide bins smooth over details; narrow bins can make a small dataset appear jagged. That is why two histograms of the same observations can look different. Analysts examine the distribution's center, spread, skewness, possible clusters and gaps, but should not claim that a ten-point sample is normally distributed simply because it has a central peak.
Technical detail: Equal-width bins make frequency-by-height comparisons straightforward. When bin widths differ, bar area must represent frequency; the height must therefore be adjusted to frequency density (frequency divided by bin width). Otherwise the picture can mislead.
Frequency, Relative Frequency, and Density
There are several legitimate choices for a histogram's vertical scale. Frequency is the count in a bin. Relative frequency is the count divided by the total number of observations; multiplying by 100 expresses it as a percentage. Density is scaled by bin width, so the area of each rectangle—not simply its height—corresponds to its proportion of observations. These are different units, and the y-axis label should say which one is being shown.
For example, if four of ten exam scores lie between 15 and under 20, that interval has a frequency of 4 and a relative frequency of 40%. With a bin width of 5, its frequency density is 4 ÷ 5 = 0.8 observations per score unit. A density normalized to total area 1 would instead be 0.4 ÷ 5 = 0.08 per score unit. These two density conventions should not be confused.
What a Histogram Can—and Cannot—Tell You
Read the numerical intervals, the vertical-axis unit, and the sample size before describing the picture. Look for where most values occur, whether the observed range is narrow or broad, and whether a few intervals are unusually sparse. The peaks and apparent skewness may shift when you change bins. A histogram can prompt further investigation, but it cannot by itself establish a probability distribution, statistical significance, or the cause of an observed pattern.
What Is a Bar Graph?
A bar graph uses the length or height of a bar to compare a value associated with each category. It might display the number of students selecting a fruit, sales by store, average delivery time by carrier, or survey responses by option. The category names identify what is being compared; the numerical scale shows how much.
Bar graphs can be horizontal or vertical. A vertical bar graph is often called a column chart, and the terms bar graph and bar chart are generally interchangeable. Categories such as fruits can be sorted by size or alphabetically. Ordered groups, including satisfaction ratings or months, should retain their meaningful sequence when it matters to the question.
For ordinary bar charts, start the value axis at zero: because the bar’s length conveys magnitude, cropping the baseline can exaggerate a small difference. Clear units and category labels matter as much as color or styling.
Vertical, Horizontal, and Grouped Bar Graphs
Use vertical bars when labels are short, such as four fruit names. A horizontal bar graph is easier to read when categories have long names or there are many of them. Grouped bars compare a small number of series within categories, such as survey responses by class. Stacked bars show components of a total, but their middle segments can be harder to compare because they do not share a common baseline.
Some categories have a natural order: weekday, grade level, or a rating from very dissatisfied to very satisfied. Preserve that order if it is central to the question. Other categories—such as stores or fruit types—can usually be sorted by value to make a comparison easier.
Histogram vs Bar Graph Examples
These two small datasets are invented for teaching. Their numbers are deliberately simple so you can check every count against the figures.
- TEST SCORES10Numerical observations · 4 adjacent bins
- MOST COMMON BIN15–<204 of 10 scores · 40% of sample
- FRUIT RESPONSES24Categorical responses · 4 categories


Example 1: Histogram of Student Test Scores
Ten students receive these scores: 12, 14, 15, 15, 18, 19, 21, 22, 24, 28. Instead of drawing one bar per score, group the observations into consecutive intervals. Use the rule lower boundary included, upper boundary excluded. For example, 15 belongs in the 15–under-20 bin, not the 10–under-15 bin.
Score intervals and frequencies (illustrative sample)
| Score interval | Scores counted | Frequency |
|---|---|---|
| 10 to under 15 | 12, 14 | 2 |
| 15 to under 20 | 15, 15, 18, 19 | 4 |
| 20 to under 25 | 21, 22, 24 | 3 |
| 25 to under 30 | 28 | 1 |
| Total | Ten observations | 10 |
The 15–under-20 interval contains four students, or 40% of this group. That is the most populated bin. Its position matters: you cannot move the 25–under-30 bar to the left and still call the result the same histogram. With only ten scores, the graph offers a quick description, not strong evidence about the shape of a larger population.
Notice what the histogram does not reveal. From the four bars alone you cannot recover the individual scores exactly: for example, the first bin tells you only that two scores were at least 10 and less than 15. The raw observations are needed to calculate an exact mean or median. Here the sorted raw scores give a mean of 18.8 and a median of 18.5, but neither can be read precisely from the binned chart.
Example 2: Bar Graph of Favorite Fruits
Now imagine a separate classroom survey asking students to choose one fruit. The responses are Apples 8, Bananas 7, Oranges 5 and Grapes 4. Those names are categories, not points on a numerical scale.
Number of students choosing each fruit (illustrative survey)
| Fruit | Students |
|---|---|
| Apples | 8 |
| Bananas | 7 |
| Oranges | 5 |
| Grapes | 4 |
| Total | 24 |
Apples have the highest count and grapes the lowest. You could sort the bars from largest to smallest without changing the meaning. A histogram would be the wrong tool: there is no meaningful five-unit interval between Apples and Bananas. Also, although the bar heights are numbers, those numbers describe the categories; they are not the values being grouped into bins.
The counts total 24 responses. Apples account for 8 ÷ 24 = 33.3%, while Grapes account for 4 ÷ 24 = 16.7%. A percentage bar graph could show these shares instead of counts. It would still be a bar graph because the horizontal labels represent fruit types, not measured intervals.
What the Two Examples Teach Us
Both figures have a numeric height scale. The difference is what appears along the other axis: ordered ranges of scores versus separate fruit labels. Choose the chart based on the role of the data, not merely whether you see numbers in the spreadsheet.
Similarities Between Histograms and Bar Graphs
Both charts use rectangular bars, turn a collection of observations into a visual summary, and can show frequencies or percentages. Both also depend on accurate scales, readable labels and a clear definition of what is being counted. A reader should be able to match a bar back to its underlying data.
The interpretation is where they part company. A histogram’s neighboring bins preserve numerical proximity, so you can discuss spread and possible skewness. In a category chart, two bars sit next to each other because of a display choice, not because their category labels are numerically close.
Why Do Histogram Bars Touch but Bar Graph Bars Have Gaps?
Intervals such as 10–under-15 and 15–under-20 meet at 15; a conventional histogram draws their bars side by side to preserve that continuous scale. Apples and Bananas are distinct answers, so spaces in a bar graph help the reader recognize separate groups.
There are exceptions to the visual shortcut. Designers can remove the spacing from a category chart without turning it into a histogram. An interval with zero observations may leave an empty stretch in a histogram. Read the axis labels before identifying the chart by its gaps.
With integer test scores, values may be discrete rather than literally continuous. A histogram is still suitable when the quantitative values are grouped into sensible adjacent intervals. Conversely, a bar graph of products labeled “101,” “102,” and “103” remains categorical if those digits are product codes rather than measured quantities.
When Should You Use a Histogram Instead of a Bar Graph?
Use a histogram when the question is about how values are distributed: Are most delivery times short? Is spending spread evenly? Does a measurement have a long tail? Choose a bar graph when the question is which group has what value: Which product sells most? How do departments compare? Which survey option received the most responses?
Quick chart selection guide
| You have… | Want to learn… | Choose |
|---|---|---|
| Individual ages or test scores | Where observations are concentrated | Histogram |
| Order waiting times | Typical range and possible long tail | Histogram |
| Votes for each candidate | Which candidate received more votes | Bar graph |
| Average score by school | Which school's average is higher | Bar graph |
| Postal codes or student IDs | How many records fall in each label | Bar graph |
When your question involves a time trend, relationship between two variables, or five-number summary, another display may be clearer. AmriData’s guide to choosing the right chart type compares those alternatives.
Can You Use a Bar Graph Instead of a Histogram?
You can place pre-grouped score ranges on the category axis of a bar chart, but that alone does not reproduce a histogram. It may hide interval widths and encourage reordering bins as though they were unrelated groups. If those ranges are equal-width numerical intervals in their correct order, the display may resemble a histogram, but its construction and labeling still need to preserve the underlying number line.
Conversely, averages by age group are category summaries, even though the category labels contain ages. A bar graph of average spending for ages 18–24, 25–34 and 35–44 is not a histogram of individual spending amounts. Ask what each bar means before deciding.
What If the Category Labels Are Numerical Ranges?
Age ranges such as 18–24 and 25–34 can appear in either type of display, depending on what is being measured. If each bar counts people whose ages fall within that interval, you are summarizing an age distribution and should treat the groups as histogram bins, paying attention to their different widths. If the bars show average spending by age group, the plotted values are category-level summaries, so a bar graph is appropriate. Labels alone do not decide the chart type.
Common Mistakes When Comparing These Charts
- Putting categories into histogram bins. Fruit types and product names have no numerical width; use a bar graph.
- Rearranging histogram intervals. Keep bins in numerical order, including intervals with zero observations.
- Choosing bins by appearance alone. Try sensible widths and see whether the interpretation is stable.
- Ignoring unequal bin widths. If widths differ, use frequency density so bar area encodes frequency.
- Truncating the bar-chart baseline. Most ordinary magnitude comparisons should begin at zero.
- Forgetting units and axes. “Frequency” and “percentage” are not interchangeable labels.
- Treating codes as measurements. ZIP codes, IDs and jersey numbers are labels even though they use digits.
- Claiming more than the chart shows. A few high bars do not establish normality, causation or statistical significance.
For examples of truncated axes, overloaded charts and confusing labels, see common data visualization mistakes.
Create a Histogram or Bar Graph With AmriData
To practice with raw numbers, enter 12, 14, 15, 15, 18, 19, 21, 22, 24, 28 in AmriData’s Histogram Maker. Choose a bin method, view the frequency or relative-frequency display, check the summary statistics, and export a PNG if you need the graphic. Its automatic binning may choose intervals different from those used in the worked example, so compare the boundaries before comparing counts.
For a category comparison, open the Bar Chart Maker. Enter the four fruit counts or paste a category/value table from a spreadsheet. You can choose vertical or horizontal bars and export the result as PNG or SVG. The two tools solve different questions; neither should replace a careful check of labels and underlying numbers.
Frequently Asked Questions
What is the main difference between a histogram and a bar graph?
A histogram groups quantitative observations into numerical intervals. A bar graph compares values for distinct categories.
Why are histogram bars touching?
Adjacent bins occupy neighboring ranges on the same numerical scale, so their rectangles normally meet at the boundaries.
Can bar graphs have touching bars?
They can be styled that way, although gaps are clearer for unrelated categories. Touching bars alone do not turn a category chart into a histogram.
Is a histogram used for categorical data?
No. Histograms summarize a quantitative variable. Use a bar graph for names, labels or other categorical responses.
Can a bar graph display numerical values?
Yes. Its bar height can encode a count, total, mean or percentage for each category. The axis of categories remains categorical.
How do histogram and bar chart examples differ?
Exam scores grouped into 10–under-15 and 15–under-20 are histogram bins. Apples, Bananas and Grapes are category labels for a bar graph.
Can you rearrange the bars in a histogram?
No. Changing the order breaks the numerical scale. Bar-chart categories can often be reordered, but ordered categories may need to stay in sequence.
What does bin width mean in a histogram?
It is the size of each numerical interval. For example, the range 15 to under 20 has a bin width of 5.
Can a histogram and a bar graph show percentages?
Yes. A histogram can show relative frequencies by interval; a bar graph can show the proportion of responses in each category. The percentage's denominator should be clear.
When should students use a histogram instead of a bar graph?
Use a histogram for individual scores, heights or measurements when the aim is to describe a distribution. Use a bar graph to compare classes, subjects or response categories.
Key Takeaways
- Choose a histogram to see how observations of one numerical variable spread across value intervals.
- Choose a bar graph when you need to compare counts, percentages, totals, or averages across categories.
- Histogram bins have an ordered numerical position and meaningful widths; bar-graph categories usually can be rearranged.
- Bars usually touch in histograms and are separated in bar graphs, but the axis meaning is the better test.
- Check bin boundaries, scales, sample sizes, and labels before interpreting either chart.
Histogram: numerical values grouped into ordered ranges. Bar graph: values compared across categories. Check what one bar represents, read its axis and units, then consider whether the question is about a distribution or a group comparison. For more practice interpreting distributions, read how exploratory data analysis works.
Related Data Visualization Guides
- How to Choose the Right Chart Type for Your Data — when your question is not a simple comparison or distribution
- Common Data Visualization Mistakes — chart design errors worth checking
- Box Plot Maker — a different summary of numerical spread and outliers
← Back to all Data Visualization articles
Statistical References
- NIST/SEMATECH — Histogram. An introduction to frequency bins and what a distribution chart can reveal.
- Penn State, STAT 200 — Describing Data, Part 1. Categorical bar charts and quantitative histograms.