
A box plot, also called a box-and-whisker plot, is a graph that summarizes the distribution of numerical data using quartiles. The box extends from the first quartile (Q1) to the third quartile (Q3); a line inside marks the median. Whiskers show the data's extent according to the chosen plotting convention. In a common modified box plot, unusually distant observations are marked separately as potential outliers.
Suppose you recorded delivery times for 13 orders. You could read every time in a spreadsheet, or use one box plot to see the median, the spread of the middle half, and whether one delivery took much longer than the rest. That compression is useful, but it also means the graph cannot show every detail of the distribution.
Want to draw one from your own numbers? AmriData’s Box Plot Maker accepts numerical groups, reports quartiles and outliers, and lets you download the chart as a PNG. This article explains how to understand the result rather than duplicate the tool's instructions.
This guide belongs to AmriData’s Statistics articles. Browse the blog for related data-analysis topics.
Box Plot Definition: What Is a Box Plot?
A box plot (also written boxplot, box-and-whisker plot, or box whisker plot) displays selected features of one numerical variable on a number line. It preserves the median and two quartiles, then extends whiskers beyond the box. Depending on the convention, whiskers reach the observed minimum and maximum or the most extreme observations within specified outlier limits.
In mathematics and statistics, the central box describes the middle half of the data by rank. It does not represent half of the distance between the smallest and largest values. A long box means that its middle 50% covers a wide numerical interval—not that it contains more observations than a short box.
- Also called: boxplot, box-and-whisker plot, box-and-whisker diagram, or box chart.
- Best for: comparing numerical centers, middle-half spread, and flagged extremes.
- Box: Q1 to Q3, with length along the number line equal to the IQR.
- Median line: the 50th percentile (Q2), not necessarily the mean.
- Whiskers: endpoints depend on whether the plot is traditional or modified.
- Separate dots: possible outliers under the selected convention, not automatically errors.
What Does a Box Plot Show?
A box plot answers several questions quickly. Where is the middle observation? How far apart are Q1 and Q3? Does one group have a wider middle range than another? Are any measurements unusually far from the main body of the sample? A set of parallel box plots makes these comparisons compact enough to place on a single shared numerical axis.
It cannot tell you how frequently each individual value occurs, where all gaps and clusters lie, or whether the data contain one peak or several. Two datasets can have identical quartiles and whiskers while distributing their observations very differently. For a fuller account of distribution shape, compare the box plot with a histogram.
Parts of a Box Plot: A Labeled Diagram
Read the picture along its numerical axis. In a horizontal box plot, Q1 forms the left edge, Q3 forms the right edge, and the median is the interior vertical line. In a vertical box plot, these positions become bottom, top, and a horizontal median line. The statistical meaning is unchanged.

First Quartile (Q1)
Q1 is the lower quartile, often described as the 25th percentile. Under the chosen calculation method, it locates the lower boundary of the middle 50% of observations. For the worked example, Q1 is 9.
Median (Q2)
The median is the central value in an ordered dataset, or the average of the two central values when the count is even. It is also called Q2. With repeated values, avoid the claim that exactly half of all observations must be strictly below the median: many can equal it. The example median is 13. For other measures of center, see mean, median and mode.
Third Quartile (Q3)
Q3 is the upper quartile, commonly associated with the 75th percentile. It marks the other end of the central box. The example Q3 is 18. The precise numerical value of a sample quartile can depend on the accepted calculation convention.
The Box and Interquartile Range (IQR)
The box runs from Q1 to Q3. Its length measured along the numerical axis is IQR = Q3 − Q1. With Q1 = 9 and Q3 = 18, the IQR is 9 units. This describes the spread of the middle half of the ordered observations. In a horizontal chart, the thickness of the rectangle has no such meaning; in a vertical chart, its horizontal width ordinarily does not represent IQR either.
Lower and Upper Whiskers
Whiskers extend outward from the box. In a traditional minimum-to-maximum plot, they end at the smallest and largest observations. In the modified style used by AmriData's maker, they end at the most extreme observed values that remain inside the 1.5 × IQR fences. A whisker length describes numerical extent, not the number of observations it contains and not a standard deviation.
Outlier Fences and Potential Outliers
Fences are calculation thresholds used in the modified plot: Q1 − 1.5 × IQR and Q3 + 1.5 × IQR. They are not necessarily drawn, and they need not coincide with a whisker endpoint. Observations strictly beyond either fence are often shown as separate points. Such a mark says “investigate this value,” not “delete this value.”
Numerical Axis and Group Labels
A useful plot labels the measured variable and its units—for example, “Delivery time (minutes).” When multiple groups are drawn, each box also needs a readable group name and ideally its sample size. Color can help distinguish groups, but it should not be the only way to identify them.
The Five-Number Summary and a Box Plot
The five-number summary lists the minimum, Q1, median, Q3, and maximum. A traditional box plot places these five values directly on the numerical axis: outer whisker ends for minimum and maximum, box edges for Q1 and Q3, and a center line for the median.
A modified box plot still uses the same central quartiles, but its plotted whiskers may not reach the raw minimum and maximum. The latter can appear as separate points. That is why a chart and a five-number table can appear to disagree even when both are correct.
Five-number summary for the 13-value example
| Statistic | Value | Where it appears |
|---|---|---|
| Minimum | 5 | Left whisker endpoint in both conventions for this sample |
| Q1 | 9 | Left box edge |
| Median | 13 | Line inside the box |
| Q3 | 18 | Right box edge |
| Maximum | 40 | Right whisker in traditional plot; separate point in modified plot |
The complete observed range is 40 − 5 = 35. That is not the same as the IQR of 9: the range uses the two outermost observations, while the IQR focuses on the central portion.
Traditional vs Modified Box Plots: Why Whiskers Differ
There is no universal rule that every box-and-whisker graph must follow. Two common constructions are worth distinguishing before you interpret the ends of the lines.
Traditional (Min–Max) Box Plot
In this classroom-style graph, the whiskers extend to the actual minimum and maximum. If you see a box from 9 to 18 and whiskers from 5 to 40, the chart is displaying the five-number summary directly. It does not independently mark 40 as a potential outlier.
Modified / Tukey-Style Box Plot
Here the box still spans Q1 to Q3, but the whiskers end at the furthest observed values within the outlier fences. With this example, the upper fence is 31.5, so the largest qualifying observation is 21. The value 40 is drawn as an individual point. The lower whisker remains 5 because it lies inside the lower fence of −4.5.
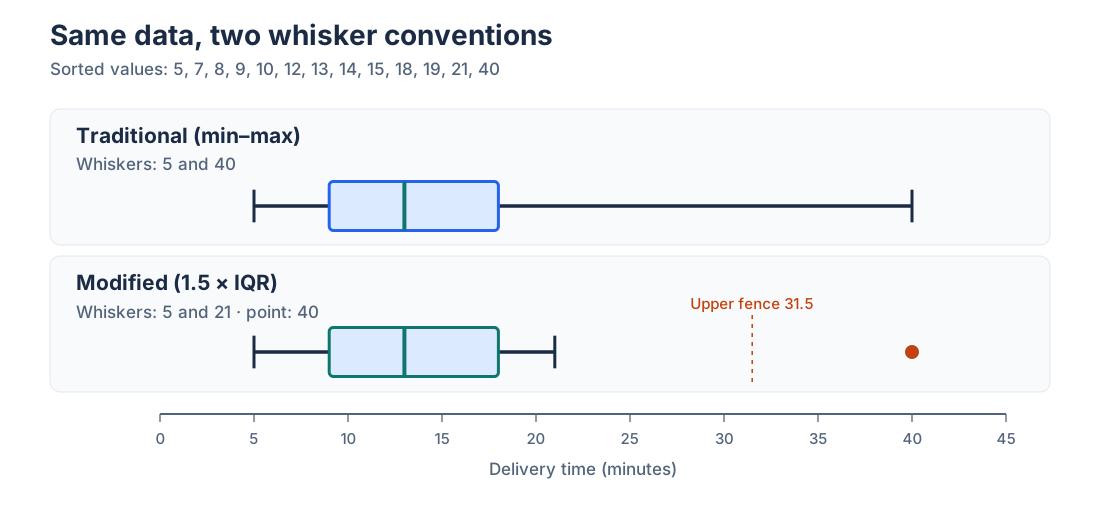
The maker on AmriData uses the modified convention: its results table reports the full minimum and maximum, while plotted whiskers use the most extreme non-flagged observations. That distinction is particularly important when comparing software screenshots.
How Are Q1, Median and Q3 Calculated?
Begin by sorting the observations from smallest to largest. The median is determined by the central position. Calculating Q1 and Q3 is less universal: different textbooks, spreadsheets, and statistical programs use different interpolation rules, especially for small samples. They can legitimately produce slightly different quartiles and hence different IQRs and outlier fences.
Median-of-Halves: A Common Classroom Method
One teaching approach finds Q1 as the median of the lower half and Q3 as the median of the upper half. When the sample size is odd, this version excludes the overall median from both halves. For the sorted example of 13 values, the lower six are 5, 7, 8, 9, 10, 12, so Q1 = (8 + 9) ÷ 2 = 8.5. The upper six are 14, 15, 18, 19, 21, 40, giving Q3 = (18 + 19) ÷ 2 = 18.5.
AmriData's Linear-Interpolation Method
AmriData’s live Box Plot Maker instead uses percentile position p × (n − 1) on the sorted observations, with positions starting at zero. If the position is fractional, it interpolates between neighboring values. For 13 observations, Q1 is at position 0.25 × 12 = 3 (the fourth value, 9), the median at position 6 (13), and Q3 at position 0.75 × 12 = 9 (the tenth value, 18).
This article's main worked example and every related diagram use AmriData's interpolation method, rather than silently mixing methods. If a homework answer gives 8.5 and 18.5, check which quartile convention the question requires before deciding that either calculation is wrong.
Box Plot Example With Data: Calculate and Draw One
These 13 hypothetical delivery times, measured in minutes, have been chosen so you can verify each step without software. We will create a modified box plot with the same quartile and outlier rules as the AmriData tool.
Raw Data and Sorted Data
Raw observations: 14, 7, 21, 10, 5, 40, 13, 18, 8, 15, 12, 19, 9.
Sorted observations: 5, 7, 8, 9, 10, 12, 13, 14, 15, 18, 19, 21, 40.
Step 1 — Find the Median
There are 13 observations. The seventh ordered value is 13, so median = 13 minutes. Half the observations by rank are on each side of this central value.
Step 2 — Find Q1
Using percentile position p × (n − 1), Q1 is at 0.25 × 12 = zero-based position 3. That is the fourth ordered value: Q1 = 9 minutes.
Step 3 — Find Q3
Q3 is at 0.75 × 12 = zero-based position 9. This is the tenth ordered value: Q3 = 18 minutes.
Step 4 — Calculate the IQR
IQR = Q3 − Q1 = 18 − 9 = 9 minutes. The central half spans a nine-minute interval under the stated quartile convention.
Step 5 — Calculate the Outlier Fences
Lower fence = 9 − 1.5 × 9 = −4.5. Upper fence = 18 + 1.5 × 9 = 31.5. A negative lower fence does not suggest an actual negative delivery time; it is only a statistical cutoff produced by the formula.
Step 6 — Find Whiskers and Flagged Values
The smallest observed value within the fences is 5; the largest is 21. The value 40 exceeds 31.5 and is therefore plotted as a potential outlier. The numerical fence 31.5 is not the upper whisker endpoint.
Step 7 — Draw the Box Plot
Draw a numerical axis; mark Q1 at 9 and Q3 at 18 to form the box; add the median line at 13. Extend the whiskers from 9 down to 5 and from 18 up to 21, then plot 40 as a separate point. Keep all positions proportional to the same axis.
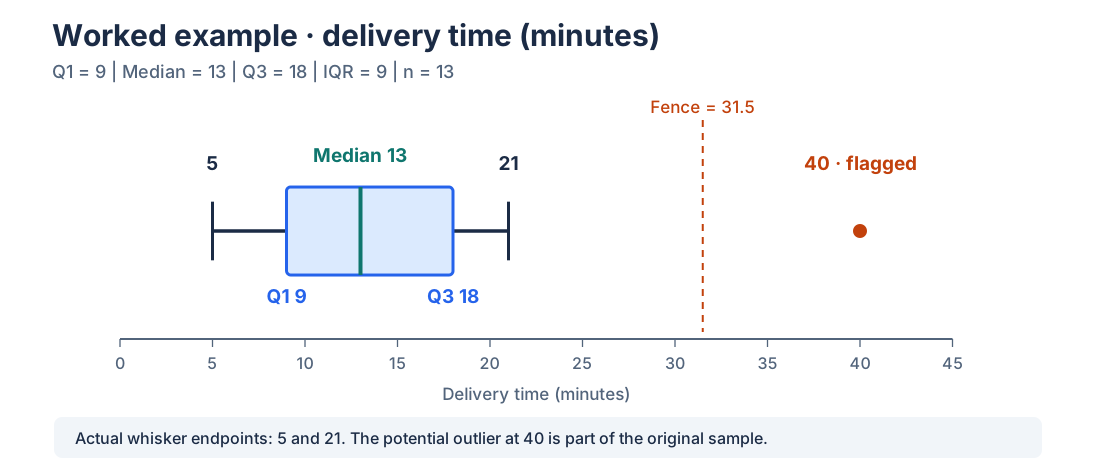
- OBSERVATIONS13Delivery times in minutes
- MEDIAN13Seventh ordered observation
- IQR9Q3 = 18 minus Q1 = 9
- FLAGGED VALUES140 minutes exceeds 31.5
Step 8 — Interpret the Result
The observed median delivery time is 13 minutes. The middle-half interval runs from 9 to 18 minutes, while the largest unflagged time is 21 minutes. One delivery took 40 minutes, much longer than the main part of this particular sample under the stated rule. The graph does not reveal why it took longer. A traffic delay, a measurement problem, or a legitimate unusual order are different explanations requiring the original records.
How to Read and Interpret a Box Plot
Start with the axis and units, not the rectangle's appearance. A box spanning 10 units may mean ten minutes, ten millimeters, or ten percentage points. Then check the plot convention and the number of observations before comparing groups.
- Identify the variable and units. Is the axis delivery time, price, test score, or some other measured quantity?
- Read the median. Find the central line and report its numerical position.
- Read Q1 and Q3. Subtract them to obtain the IQR; a longer box along the numerical axis means a wider middle-half interval.
- Examine the whiskers. Determine whether they represent min/max or the most extreme observations within outlier fences.
- Inspect isolated points. In a modified plot, ask which rule flagged them and whether they are meaningful.
- Look for possible asymmetry. An off-center median or noticeably longer upper side can be consistent with skew, but it does not prove a distribution shape.
- Check sample size. A box plot made from eight values can look as tidy as one made from 8,000; the visual alone often conceals this difference.
- Compare groups on the same scale. Different axis limits can make the same numerical difference look much larger or smaller.
Can a Box Plot Show Skewness?
An uneven position of the median or unequal whisker lengths can suggest asymmetry. For example, a longer upper-side span can be consistent with a right-skewed distribution. It is not conclusive: box plots discard the detailed frequency pattern, and distinct datasets can share the same quartiles. A longer whisker does not necessarily mean more observations sit there.
Does a Symmetric Box Plot Mean the Data Are Normal?
No. Similar-looking whiskers and an approximately centered median do not establish normality, unimodality, or a particular probability distribution. When those features matter, inspect the Histogram Maker output, individual observations, or a Q–Q plot as appropriate.
How to Compare Two Box Plots
Parallel or side-by-side box plots can summarize test results by class, wait times by service team, or a measurement by study group. Make sure they use one numerical scale and compatible quartile and whisker rules. Then compare median, IQR, whisker extent, flagged points, and sample sizes separately.
Example 1 — Same Median, Different Spread
Consider two hypothetical nine-observation groups. Narrow: 7, 9, 11, 12, 15, 16, 19, 20, 23. Wide: 2, 4, 7, 11, 15, 19, 23, 26, 29. Both have median 15, but Narrow has Q1 = 11 and Q3 = 19 (IQR 8), while Wide has Q1 = 7 and Q3 = 23 (IQR 16). The wider box says the central values are more spread out, not that Wide has more observations; both groups contain nine.
Example 2 — Different Median, Same IQR
Now compare Lower: 5, 7, 10, 12, 14, 16, 18, 20, 22, with Higher: 13, 15, 18, 20, 22, 24, 26, 28, 30. The medians are 14 and 22, but each IQR is 8. The central position has shifted by eight units without changing the middle-half spread.
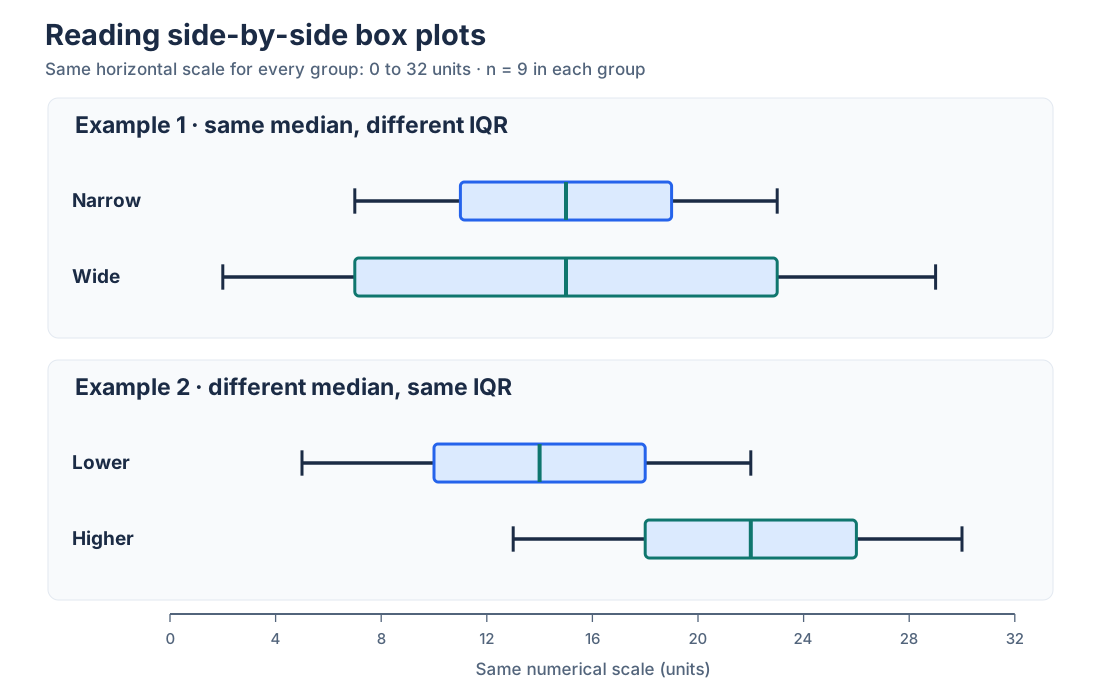
These are descriptive differences in example samples. They are not proof that the underlying populations differ or that a statistical test would be significant. The plot says nothing about sampling design, confounding factors, or uncertainty on its own.
Summary of the four comparison groups (linear-interpolation quartiles)
| Group | n | Q1 | Median | Q3 | IQR |
|---|---|---|---|---|---|
| Narrow | 9 | 11 | 15 | 19 | 8 |
| Wide | 9 | 7 | 15 | 23 | 16 |
| Lower | 9 | 10 | 14 | 18 | 8 |
| Higher | 9 | 18 | 22 | 26 | 8 |
The 1.5 × IQR Rule and Outliers Explained
In the common modified convention, multiply the IQR by 1.5 and subtract it from Q1 or add it to Q3. These two limits are called the inner fences. An observation strictly outside either fence is flagged. The whisker endpoints are then selected from real observations at or inside the fences. The result is not a formal statement that each flagged value was generated by an error.
The choice of 1.5 is a familiar exploratory convention, not a universal scientific threshold. Another charting implementation may use different whiskers, and researchers sometimes examine additional outer fences at 3 × IQR. Always read the stated rule instead of treating every separate point as equivalent.
Should You Remove Values Outside the Whiskers?
Not automatically. First confirm the recorded number and unit. Then examine the event or subject associated with the observation, check whether it belongs to the intended population, and assess whether an exclusion would change your conclusion. If you remove a value, document why and retain the original data. Removing a genuinely slow delivery simply because it looks inconvenient would distort the service record.
The median and IQR are generally more resistant to the magnitude of extreme observations than the mean and standard deviation. They are not magically unaffected by every data change, and they do not answer the same questions as mean and SD.
Types of Box Plots
Most named variations change orientation, whisker treatment, or the amount of comparison information shown; they are not wholly different statistical ideas.
- Traditional or min–max: whiskers reach the smallest and largest observed values.
- Modified or Tukey-style: whiskers reach extreme observations within the outlier fences, with flagged points shown separately.
- Horizontal: the numerical scale runs left to right, useful for longer group labels.
- Vertical: the numerical scale runs bottom to top; the box height represents IQR.
- Side-by-side or grouped: several distributions share a numerical scale for comparison.
- Notched: a notch may illustrate uncertainty around the median; its calculation and interpretation depend on the implementation.
- Variable-width: the visual box thickness may encode sample size or another specified quantity; check the chart's documentation.
In a standard fixed-width box plot, box thickness is not a count of observations. Do not import the interpretation of a variable-width version unless that feature is explicitly documented.
Box Plot vs Histogram: Which One Answers Your Question?
Both charts summarize a numerical distribution, but they preserve different information. A box plot is a five-number-style summary with a middle-half spread and optional outlier markers. A histogram groups observations into intervals and shows frequencies or shares within those intervals. That makes peaks, gaps, and the general shape easier to examine, although the appearance depends on bin choices.
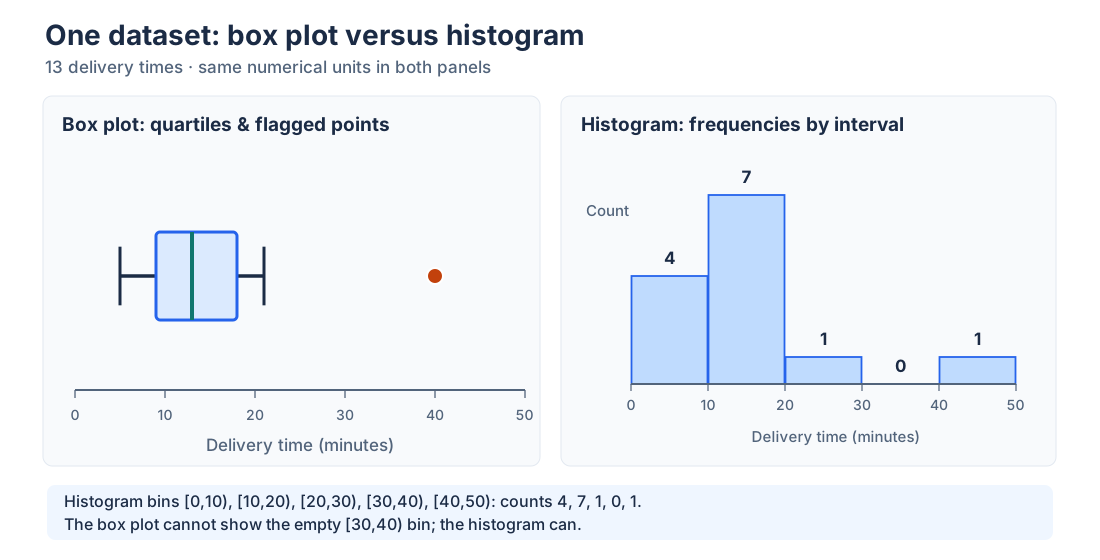
Box plot vs histogram
| Question | Box plot | Histogram |
|---|---|---|
| Where is the median? | Directly marked | Not usually marked by default |
| How spread out is the middle half? | IQR directly visible | Requires raw data or a separate calculation |
| Does the distribution have peaks or gaps? | Cannot reliably show them | Often visible, depending on binning |
| Compare several groups? | Compact with a shared axis | Usually needs several panels or overlays |
| What settings matter? | Quartile and whisker conventions | Bin boundaries, width, and vertical scale |
Use AmriData’s Histogram Maker when you need to inspect how often values occur across numerical intervals. Use the Box Plot Maker when median, IQR, and between-group comparisons are the main task. For exploratory work, the two views often answer different parts of the same question.
Box Plot vs Bar Graph, Violin Plot and Dot Plot
Box Plot vs Bar Graph
A bar graph usually compares a count, total, percentage, or summary value for named categories. A box plot compares the distributions of numerical observations within those categories. “Average delivery time by carrier” can be a bar chart; the full spread of individual delivery times by carrier can be a grouped box plot. For categorical summaries, use the Bar Chart Maker. The related histogram vs bar graph guide explains another common chart confusion.
Box Plot vs Violin Plot
A violin plot adds a smoothed depiction of estimated data density around the numeric axis. It can make multiple peaks or unequal concentrations easier to spot, but the appearance depends on smoothing choices and sufficient data. A box plot is typically easier for a quick comparison of medians and quartiles.
Box Plot vs Dot Plot or Scatter Plot
A dot or strip plot displays individual values and is often more informative for very small samples. A scatter plot places paired numerical variables on two axes to examine their relationship; it does not merely summarize one variable. If the question is which graphic fits your data, see how to choose a chart type.
When Should You Use a Box Plot?
Choose a box plot when you have quantitative measurements and need a compact comparison of central location, middle-half spread, and potentially unusual observations. Examples include exam results across classes, lab measurements across treatments, wait times across support teams, and delivery times across regions. It is a common step in exploratory data analysis, especially before deciding which assumptions or models deserve closer examination.
It is less helpful when the entire dataset has only a handful of observations, when you need to see the number of peaks or the detailed shape, or when the values are categorical labels rather than meaningful numerical measurements. Box plots also hide sample size unless it is supplied separately, and a summary can make highly unequal group sizes look deceptively comparable.
How to Make a Box Plot Manually or Online
To draw one by hand, put the values in order, choose and state a quartile convention, calculate Q1, median, Q3, and IQR, decide whether to use min–max or modified whiskers, then plot the statistics on a scaled axis. In a modified plot, calculate fences first and mark observations outside them separately. Label units and give the sample size.
For your own dataset, open AmriData’s Box Plot Maker, paste numeric values, optionally enter multiple named groups, generate the chart, and review its summary table. Its live documentation confirms the p × (n − 1) interpolation method, 1.5 × IQR rule, optional outlier and mean markers, and PNG export. You can paste the 13-value example from this article to compare the displayed numbers with the calculations above.
Missing values should never be silently treated as actual zeros. Check what was recorded, which observations belong in the sample, and the input instructions of the chosen tool before drawing conclusions.
Common Box Plot Mistakes
- “Whiskers always show minimum and maximum.” Only in the traditional convention; a modified plot may flag the extremes separately.
- “Fences are the whisker endpoints.” Fences are calculated thresholds; whiskers normally stop at real observations within them.
- “A long box means more data points.” A longer box along the value axis means larger IQR, not higher sample count.
- “An outlier dot must be wrong.” It may be a valid rare observation. Inspect context and original records before any exclusion.
- “Whiskers are standard deviations.” They represent a chosen extent outside the quartiles, not a mean-based spread formula.
- “The middle line is the mean.” It is the median; some software can add a separate mean marker.
- “Different quartiles mean a broken tool.” Check each package's quantile interpolation method.
- “A balanced box proves a normal distribution.” A box plot cannot show all density peaks or establish normality.
- “A median difference proves a treatment effect.” Visual differences alone do not establish statistical significance or causation.
- “Group sample sizes do not matter.” A narrow box from nine observations may be much less stable than one from thousands.
- “I can compare charts with different scales directly.” Use a shared numerical scale for fair side-by-side interpretation.
- “All data problems are visible in the graph.” Check the raw records for missing values, duplicated units, unusual clusters, and entry errors.
Additional presentation issues, including unclear axes and distorted comparisons, appear in common data visualization mistakes.
Frequently Asked Questions About Box Plots
What is a box plot in simple terms?
A box plot is a graph that uses a box and whiskers to summarize numerical data. It marks the median, Q1, Q3, and the extent of the observations according to a stated whisker rule.
Is a boxplot the same as a box-and-whisker plot?
Yes. Boxplot, box plot, and box-and-whisker plot are names for the same family of statistical displays. The details of the whisker rule can differ.
What does the box represent?
It spans Q1 to Q3, corresponding to the middle 50% by rank under the chosen quartile convention. It does not describe half of the full numerical range.
What do Q1 and Q3 mean?
Q1 is the first or lower quartile, commonly associated with the 25th percentile. Q3 is the third or upper quartile, associated with the 75th percentile. Their exact sample values depend on the quantile method.
What does the line inside a box plot mean?
It marks the median (Q2), not necessarily the arithmetic mean. For an ordered sample, it is the central value or average of the two central values.
What is IQR in a box plot?
The interquartile range is Q3 − Q1. It measures the numerical spread of the central half of the sample.
What do the whiskers mean?
Traditional whiskers reach the observed minimum and maximum. Modified whiskers generally reach the most extreme actual observations within the chosen outlier fences.
Do whiskers always equal 1.5 times IQR?
No. The 1.5 × IQR rule determines common outlier fences, not necessarily whisker lengths. The plotted ends usually coincide with actual qualifying values.
Does an outlier on a box plot mean bad data?
No. It is a point flagged by a statistical convention. It may represent a real unusual outcome, a mistake, or an observation from a different process.
How do I make a box plot?
Sort the values, calculate quartiles and IQR under a stated method, select the whisker convention, and plot the box, median, whiskers, and any flagged observations on a number line. Or use the Box Plot Maker.
Can a box plot show whether data are normal?
It can suggest broad symmetry, but cannot prove normality or reveal every peak. Inspect raw values, a histogram, or other diagnostics when distribution shape matters.
Does a box plot show sample size?
Not usually in a fixed-width display. Add n for each group; some variable-width box plots use width to encode sample size, but this must be labeled.
What is the difference between a box plot and a histogram?
A box plot emphasizes quartiles, median, IQR, and possible extremes. A histogram emphasizes frequencies over numerical intervals and is better for seeing distribution shape.
Key Takeaways
- A box plot summarizes numerical observations through quartiles, a median line, whiskers, and sometimes separate potential-outlier points.
- The box spans Q1 to Q3; IQR = Q3 − Q1 describes the central half's numerical spread.
- Traditional whiskers may show minimum and maximum; modified whiskers use extreme observed values within outlier fences.
- Sample quartiles can differ across accepted calculation methods. The article's worked numbers use the method documented for AmriData's tool.
- Potential outliers deserve examination, not automatic removal.
- Use a histogram or raw-value plot alongside a box plot when peaks, gaps, clusters, or distributional assumptions matter.
The safest way to read any box diagram is to identify the axis, the quartiles, and the whisker convention before discussing shape or outliers. The box is compact because it leaves details out. For a wider analysis workflow, consult what data analysis involves and the associated exploratory-analysis guide.
Related Statistics Guides and Tools
- Box Plot Maker — paste numerical groups, review quartiles, and export a box plot
- Histogram Explained — see the full frequency pattern behind a numerical distribution
- Histogram Maker — draw a histogram from your own values
- Mean, Median and Mode — distinguish measures of central location
- Standard Deviation Explained — compare a mean-based spread measure with IQR
- How to Choose the Right Chart Type — decide when another graph communicates more
- Exploratory Data Analysis — place graphical checks in a broader workflow
← Back to all Statistics articles
Statistical References
- NIST/SEMATECH e-Handbook of Statistical Methods — Box Plot. Explains quartiles, IQR, whisker conventions, and outlier fences.
- Penn State STAT 414 — Exploring Continuous Data. Introduces the traditional five-number-summary box plot.
- Penn State STAT 800 — Explaining Variability. Shows that quartile computation conventions can differ across courses and software.
- OpenStax Introductory Statistics — Box Plots. Describes min–max plots and outlier-point variants.