
To make a box plot, sort your numerical data, find the median, first quartile (Q1) and third quartile (Q3), then draw a box from Q1 to Q3 with a line at the median. Add whiskers using the convention required for your chart. If you are making a modified box plot, use the 1.5 × IQR rule to flag potential outliers and draw them separately.
You can do this with a pencil and a number line. We will start with eight values that have no outliers, then work through nine values where the largest observation changes the whisker. Every calculation is shown, including why a calculated outlier fence is not necessarily where a whisker ends.
This tutorial is part of AmriData's Data Visualization guides. If you already understand the arithmetic and only want a chart, the Box Plot Maker provides an online alternative.
How to Make a Box Plot in 8 Steps
- Sort the data from the smallest number to the largest.
- Find the median (Q2), the middle value or average of the two middle values.
- Find Q1, the median of the lower half under the method used in this tutorial.
- Find Q3, the median of the upper half under the same method.
- Calculate the IQR by subtracting Q1 from Q3.
- Choose the whiskers: use the minimum and maximum for a traditional plot, or use outlier fences for a modified plot.
- Draw the box and median at their real positions on a scaled number line.
- Add whiskers, any flagged points, and labels so the finished chart can be read accurately.
The rest of the guide unpacks those steps. If your class uses a particular quartile rule, follow that rule throughout; changing calculation methods midway produces a different plot.
What Do You Need to Make a Box Plot?
Start with one set of numerical observations, paper or a spreadsheet for sorting, and a ruler if you are drawing by hand. A traditional box-and-whisker plot uses a five-number summary: minimum, Q1, median, Q3 and maximum. A modified plot also needs the interquartile range and the observations used to decide which values fall outside its fences.
- Minimum and maximum: smallest and largest observed values in the full dataset.
- Q1 and Q3: the boundaries of the middle half, according to your chosen quartile convention.
- Median (Q2): the center of the ordered observations.
- IQR: Q3 − Q1; the numerical length of the box.
- Whisker endpoints: determined by the traditional or modified plot rule.
- Axis: a uniformly scaled number line, with units where relevant.
Choose the Type Before You Draw the Whiskers
Two common box-plot conventions look the same when there are no flagged outliers, but they can look quite different for the same data once an extreme value appears.
Traditional (minimum-to-maximum) box plot
The box runs from Q1 to Q3, the middle line marks the median, and the whiskers go to the actual minimum and maximum. This is common in classroom exercises built directly from the five-number summary. It does not independently mark potential outliers.
Modified (Tukey-style) box plot
The box and median stay in the same positions, but the whiskers stop at the most extreme observed values that lie inside the 1.5 × IQR fences. Observations outside those fences are plotted as individual points. The fence itself is a cutoff, not a plotted data value.
The worked examples below use a modified plot and the median-of-halves quartile method. We will also show where the traditional whiskers would go, so the two conventions are not mixed.
How to Make a Box Plot Step by Step
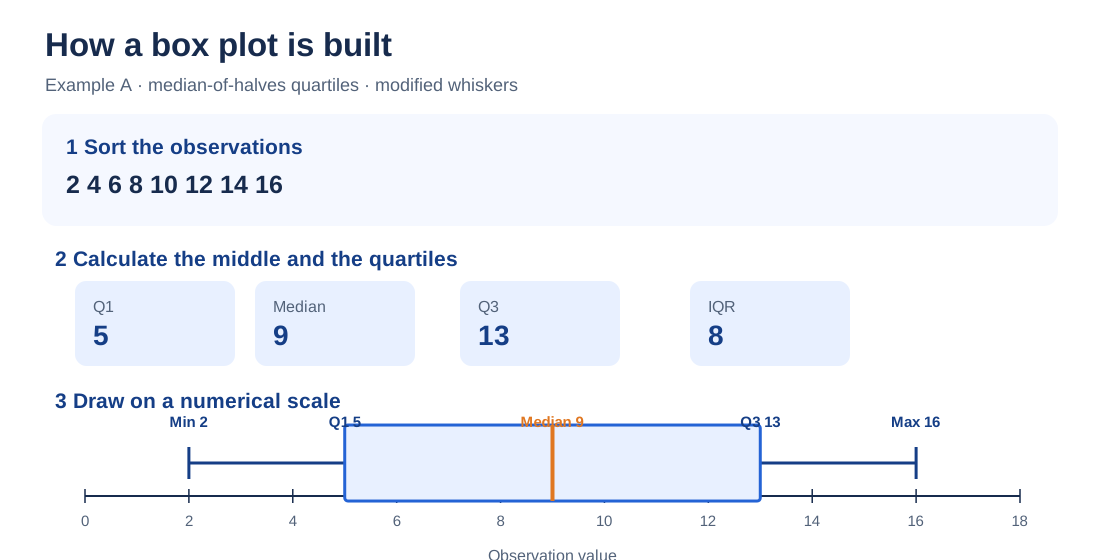
For our first box plot, use these eight sample observations, which could represent the number of minutes spent completing a small task:
Unsorted data: 12, 4, 16, 8, 2, 14, 10, 6.
Step 1: Sort the Data
Put the numbers in ascending order: 2, 4, 6, 8, 10, 12, 14, 16. Quartile positions refer to ordered values. Finding the middle of the unsorted list is a common cause of incorrect homework answers.
Step 2: Count the Values and Find the Median
There are eight observations, so n = 8. With an even number of values, take the average of the two middle numbers. The fourth and fifth values are 8 and 10, making median (Q2) = (8 + 10) ÷ 2 = 9. The median is the middle of the dataset, not necessarily its arithmetic mean. See the mean, median and mode guide if those measures are easy to confuse.
Step 3: Find Q1, the Lower Quartile
Split the ordered list into two equal halves. The lower half is 2, 4, 6, 8. Its middle numbers are 4 and 6, so Q1 = (4 + 6) ÷ 2 = 5.
Step 4: Find Q3, the Upper Quartile
The upper half is 10, 12, 14, 16. Its middle numbers are 12 and 14, so Q3 = (12 + 14) ÷ 2 = 13. Together, Q1 and Q3 tell you where the middle part of the sample sits on the number line.
Step 5: Calculate the Interquartile Range (IQR)
Subtract the first quartile from the third: IQR = Q3 − Q1 = 13 − 5 = 8. The box will therefore cover an interval eight units long. It does not mean that eight observations are inside the box. Quartiles divide the ordered observations into portions of roughly 25% each, but those portions need not occupy equal numerical distances.
Step 6: Calculate Outlier Fences for a Modified Plot
Use the lower fence Q1 − 1.5 × IQR and upper fence Q3 + 1.5 × IQR. Here the results are:
- Lower fence: 5 − 1.5 × 8 = 5 − 12 = −7.
- Upper fence: 13 + 1.5 × 8 = 13 + 12 = 25.
All eight observations lie between −7 and 25. None is flagged as a potential outlier by this rule. If you are using the traditional min–max convention, you do not need the fences to position its whiskers.
Step 7: Find the Whisker Endpoints
Because no observations fall outside the fences, the modified whiskers end at 2 and 16. Those also happen to be the true minimum and maximum, so a traditional box plot would look identical for this first example.
Step 8: Draw a Scaled Number Line
Draw a horizontal axis, with evenly spaced marks at 0, 2, 4, 6, 8, 10, 12, 14, 16 and 18. The spacing must reflect the numbers: a gap of ten units takes twice as much space as a gap of five. Do not arrange the five summary numbers at equal distances simply because there are five of them.
Step 9: Draw the Box From Q1 to Q3
Put the left edge of a rectangle above 5 and the right edge above 13. The rectangle's length along the horizontal axis corresponds to the IQR of 8.
Step 10: Add the Median Line
Draw a vertical line inside the box at 9. In this dataset it lands halfway between Q1 = 5 and Q3 = 13. Do not force it to the center in every problem: the line belongs at the median's numerical value, even if that makes one side of the box wider.
Step 11: Add the Whiskers
Draw one line from Q1 = 5 to the lower whisker at 2, and another from Q3 = 13 to the upper whisker at 16. Short end caps can make those endpoints easier to locate, but are optional.
Step 12: Add Potential-Outlier Points
There are no outlier points to add in Example A. When a value is outside the modified plot's fences, draw a separate dot at that value instead of stretching the whisker to include it. Our next example demonstrates this with the value 40.
Step 13: Label Your Plot
Label the axis with the variable and units, such as “Task completion time (minutes),” and identify the group if you have more than one. For a report, include the sample size and state the quartile and whisker conventions. “Values” alone is seldom an informative axis label.
Complete Box Plot Example With an Even Number of Values
Here is the entire calculation in one place. You can check your drawing against it before starting the odd-number example.
Example A: 2, 4, 6, 8, 10, 12, 14, 16 — modified 1.5 × IQR plot
| Statistic | Value | Reason |
|---|---|---|
| Sample size | 8 | Eight sorted observations |
| Minimum | 2 | First observation |
| Q1 | 5 | (4 + 6) ÷ 2 |
| Median (Q2) | 9 | (8 + 10) ÷ 2 |
| Q3 | 13 | (12 + 14) ÷ 2 |
| Maximum | 16 | Last observation |
| IQR | 8 | 13 − 5 |
| Lower / upper fence | −7 / 25 | Q1 − 1.5 × IQR / Q3 + 1.5 × IQR |
| Lower / upper whisker | 2 / 16 | Observed values inside the fences |
| Potential outliers | None | Every value is inside the fences |
How to Make a Box Plot With an Odd Number of Values
When the number of observations is odd, the overall median is the single middle value. For the median-of-halves method used in this tutorial, leave that middle observation out of both halves, then find Q1 and Q3. This is a common classroom convention, not the only accepted quartile method.
For the ordered data 2, 4, 6, 8, 10, 12, 14, 16, 40, n = 9 and the fifth number is 10. Exclude 10. The lower half is 2, 4, 6, 8, giving Q1 = 5. The upper half is 12, 14, 16, 40, giving Q3 = (14 + 16) ÷ 2 = 15.
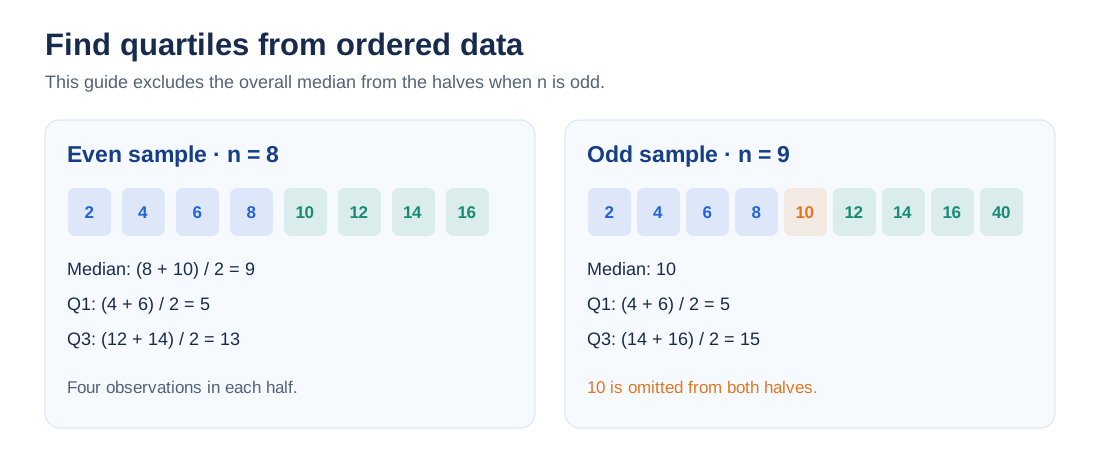
Other textbooks and software may include the overall median in the two halves, or interpolate between ranked values. That can change Q1, Q3, the IQR and the fences. Write down the method you used rather than treating a different valid result as a software mistake.
Box Plot Example With a Potential Outlier
Example B uses the same first eight numbers as Example A, plus a much larger ninth observation. This time the plotting convention matters.
Sorted observations: 2, 4, 6, 8, 10, 12, 14, 16, 40.
We already found median = 10, Q1 = 5, Q3 = 15. So IQR = 15 − 5 = 10. The modified plot's outlier fences are:
- Lower fence: 5 − 1.5 × 10 = −10.
- Upper fence: 15 + 1.5 × 10 = 30.
The observation 40 is above 30, so the 1.5 × IQR rule flags it as a potential outlier. The largest observation still inside the fences is 16, not 30. Thus the modified box plot has whiskers at 2 and 16, with 40 plotted separately. A traditional version instead extends its upper whisker to the observed maximum of 40.
Example B: nine observations — modified 1.5 × IQR plot
| Statistic | Value | How it was found |
|---|---|---|
| Sample size | 9 | Count the observations |
| Minimum | 2 | Smallest observation |
| Q1 | 5 | Median of 2, 4, 6, 8 |
| Median | 10 | Fifth ordered observation |
| Q3 | 15 | Median of 12, 14, 16, 40 |
| Maximum | 40 | Largest observation; plotted separately |
| IQR | 10 | 15 − 5 |
| Lower / upper fence | −10 / 30 | 5 − 15 / 15 + 15 |
| Lower / upper whisker | 2 / 16 | Extreme observed values inside fences |
| Potential outlier | 40 | 40 > upper fence of 30 |
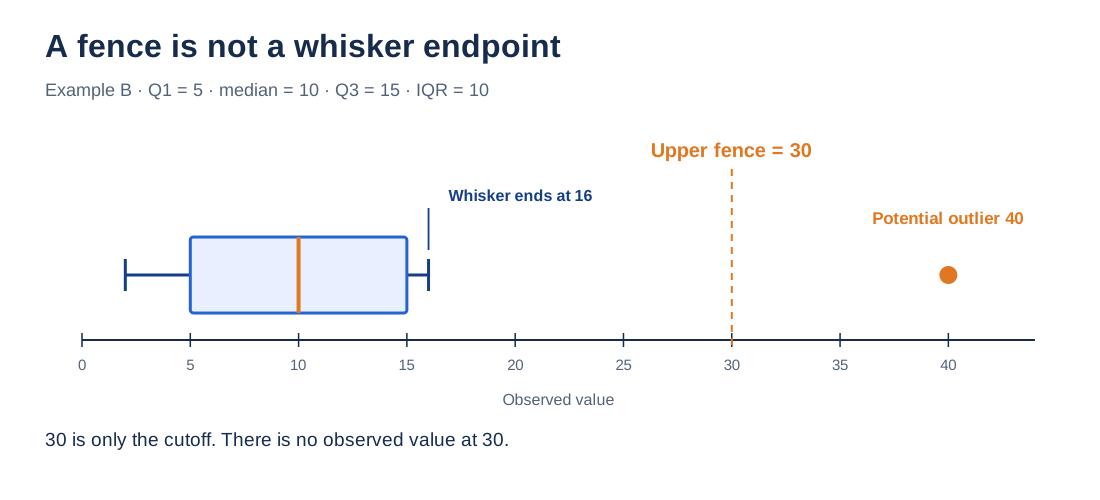
Calling 40 a potential outlier does not mean it is wrong. If the values were delivery times, for example, you would check the original order record before deciding whether a delay, a data-entry mistake or a legitimate unusual case produced it.
Why the Fence and Whisker Are Not the Same Thing
An outlier fence is calculated using the quartiles. A whisker endpoint, in a modified plot, is selected from the observed data that fall inside those fences. Because the observation 30 does not occur in Example B, there is no reason to draw a whisker to 30. The upper whisker must end at 16, the largest qualifying observation.
This distinction is particularly useful when checking your work: write the fences in your calculation table, then separately identify the values where your whiskers will actually stop.
How to Draw Traditional and Modified Box Plots
For the nine values in Example B, both constructions have Q1 = 5, median = 10 and Q3 = 15. Only the outer treatment changes. The traditional version connects the upper side of the box to 40. The modified version connects it to 16 and draws an isolated point at 40. The lower whisker is 2 in both.

If an assignment says “draw a box and whisker plot using the five-number summary,” a traditional plot may be intended. If it asks you to mark outliers by the 1.5 × IQR rule, the modified version is usually the relevant one. Follow the instructions given rather than assuming every boxplot uses identical whiskers.
Why Your Quartiles May Differ From an Online Maker
This tutorial uses median-of-halves quartiles. AmriData's live Box Plot Maker documents a different calculation for raw values: it sorts the data, locates the percentile at position p × (n − 1) (starting from position zero), and interpolates between neighboring values when needed.
For Example A, that method gives Q1 = 5.5, median = 9 and Q3 = 12.5, rather than the manual Q1 = 5 and Q3 = 13. The modified whiskers still end at 2 and 16. For Example B, the maker's method gives Q1 = 6, median = 10 and Q3 = 14, with fences −6 and 26; it still flags 40 and stops its upper whisker at 16. These are method differences, not a contradiction in the original observations.
Do not combine the median-of-halves Q1 with an interpolation-based Q3 in one chart. For homework, use the method specified by your teacher. For software comparisons, check the calculation settings and report which method each chart uses.
How to Draw an Accurate Number Line
The positions on a box plot must be proportional to their numerical values. Suppose a summary contains 2, 5, 10, 15 and 40. The distance from 15 to 40 represents 25 units; drawing those endpoints as close together as 2 and 5 would distort the display.

For a vertical box plot, use the same calculations but turn the numerical axis upright. The median becomes a horizontal line and the whiskers extend upward and downward. The statistical meaning does not change.
How to Make Side-by-Side Box Plots
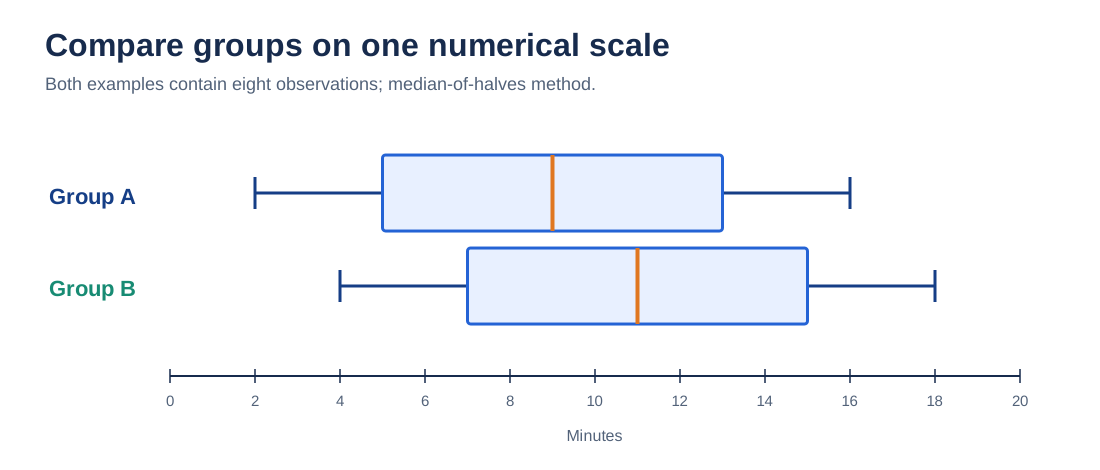
To compare two classes, teams or measurement periods, calculate a separate box plot for each group, then draw the boxes on one common numerical scale. Use the same quartile method and whisker convention for both groups, and label each group and sample size.
For a simple illustration, Group A contains 2, 4, 6, 8, 10, 12, 14, 16. Group B contains 4, 6, 8, 10, 12, 14, 16, 18. Under the median-of-halves method, both have IQR = 8, but their medians are 9 and 11 respectively. Those observations show a higher median in Group B; they do not, by themselves, establish statistical significance.
For more on placing this check in an analysis workflow, see the steps of exploratory data analysis.
When Should You Make a Box Plot?
Make a box plot when you need a compact look at a numerical variable's median, middle-half spread and unusually distant values, especially across several groups. A box plot is less useful if your main question concerns peaks, gaps or the exact frequency of different values: try a histogram or the Histogram Maker for that.
Box plots use IQR as a measure of spread. If your work instead calls for variability around the arithmetic mean, consult standard deviation explained. If you are deciding between several possible graph types, read how to choose the right chart type.
How to Make a Box Plot Online
If you have your numbers ready and do not need to construct the diagram manually, open AmriData's free Box Plot Maker. Choose raw observations, paste a list of numbers (or several named groups), generate the plot and review the quartiles, IQR and flagged outliers. The live tool also supports PNG download and an alternative mode for entering a five-number summary.
For multiple groups, the documented raw-input format is Class A | 2, 4, 6, 8, with another named group on the next line. Raw data use a modified 1.5 × IQR plot. Five-number-summary mode draws whiskers to the minimum and maximum you supply and cannot reconstruct individual outliers from those five numbers alone.
Check your calculations before comparing: the online maker's quartile interpolation can produce different Q1 and Q3 values from the median-of-halves arithmetic shown above.
Common Mistakes When Constructing a Box Plot
- Skipping the sorting step. The middle positions are defined only after numerical ordering.
- Using the wrong two values for an even-sample median. Count positions carefully before averaging.
- Changing quartile methods halfway through. Stick to one rule for the whole calculation.
- Assuming every whisker reaches the raw minimum or maximum. Modified plots may flag extremes separately.
- Drawing the whisker to a fence. A fence is a threshold; the endpoint must be an observed non-flagged value.
- Putting the median at the visual center of every box. Place it at its numerical position.
- Giving every quartile segment the same length. Their values may be unevenly spread.
- Failing to label units or groups. A numerical plot without context is hard to interpret.
- Deleting flagged observations automatically. An unusual point deserves checking, not immediate removal.
- Expecting a box plot to show every cluster or peak. This chart deliberately reduces the data to a few summaries.
For broader chart presentation problems, including misleading axes, see common data visualization mistakes.
Troubleshooting Your Box Plot
My quartiles do not match the software.
Confirm the data were sorted and copied correctly. Then check whether the software uses median-of-halves, inclusive halves or an interpolated percentile. With small samples, these methods can differ even when both are valid.
My upper whisker does not reach the maximum.
In a modified plot, a maximum beyond the upper fence is drawn separately. In a traditional plot, the whisker normally does reach the maximum.
My whisker ends before the upper fence.
That is expected if the largest observation inside the fence is smaller than the calculated threshold. Example B ends at 16 even though its upper fence is 30.
My median line is not centered.
It need not be. Its position depends on the numerical distance from Q1 to the median and from the median to Q3.
My box is extremely narrow or I have no outliers.
A narrow box may reflect clustered middle values, or simply a very wide axis range. No flagged values is a valid result; you should not invent outliers. If Q1 = Q3, the IQR is zero and a box may collapse to a line, so check repeated values and the chart's behavior.
Practice Problems: Draw the Box Plot Yourself
Use the median-of-halves method, excluding the overall median when n is odd. Unless a question says otherwise, use modified 1.5 × IQR whiskers.
- Even sample: For 2, 4, 6, 8, 10, 12, 14, 16, find Q1, median, Q3, IQR, fences and whiskers.
- Odd sample without outliers: For 3, 5, 7, 9, 11, 13, 15, find the three quartiles and determine whether any value is flagged.
- High outlier: For 2, 4, 6, 8, 10, 12, 14, 16, 40, find both fences and identify the upper whisker endpoint.
- Low outlier: For −25, 2, 4, 6, 8, 10, 12, 14, 16, calculate the quartiles, fences, whiskers and flagged observation.
- Spot the drawing mistake: A student draws an upper whisker at 30 after finding an upper fence of 30, even though the largest value below that fence is 16. What needs changing?
- Choose a chart: Would you use a histogram or a box plot to study two peaks in a distribution? Which is easier for comparing the medians and IQRs of five groups?
Practice Solutions With Calculations
- Even sample: The median is (8 + 10) ÷ 2 = 9; Q1 = (4 + 6) ÷ 2 = 5; Q3 = (12 + 14) ÷ 2 = 13. IQR = 8. Fences are −7 and 25. Every observation is inside them, so whiskers are 2 and 16 and no values are flagged.
- Odd sample: The middle number is 9. Excluding it, the lower half is 3, 5, 7 (Q1 = 5), while the upper half is 11, 13, 15 (Q3 = 13). IQR = 8; fences are −7 and 25. All values qualify, so whiskers run from 3 to 15.
- High outlier: Median = 10, Q1 = 5 and Q3 = 15, so IQR = 10. Fences are −10 and 30. The value 40 is flagged, leaving 16 as the largest qualifying value. Lower whisker = 2; upper whisker = 16.
- Low outlier: Median = 8. Excluding it, lower half −25, 2, 4, 6 gives Q1 = (2 + 4) ÷ 2 = 3. Upper half 10, 12, 14, 16 gives Q3 = (12 + 14) ÷ 2 = 13. IQR = 10, so fences are −12 and 28. The −25 observation is flagged; whiskers stop at 2 and 16.
- Whisker mistake: Move the upper whisker to 16, the largest observed value within the upper fence. Keep 30 in the calculation table as the fence, not the whisker endpoint.
- Chart choice: Use a histogram to examine whether the data have two peaks, because a box plot hides that detail. Use comparable box plots on a shared scale to compare the five groups' medians and IQRs.
Frequently Asked Questions About Making Box Plots
How do you make a box plot step by step?
Sort the values, find the median and quartiles, calculate the IQR, choose the whisker rule, and draw the box from Q1 to Q3 with a median line. Add whiskers and any potential-outlier dots on a proportional number line.
How do you make a box-and-whisker plot?
Use the same construction. “Box-and-whisker plot,” “box plot” and “boxplot” refer to the same family of graphs; the main detail to check is whether the whiskers use min–max endpoints or a modified outlier rule.
What five numbers do you need for a box plot?
The minimum, Q1, median, Q3 and maximum make the five-number summary for a traditional plot. A modified plot may show extreme flagged observations as separate dots rather than ending its whiskers at the original minimum or maximum.
How do you find Q1 and Q3 when making a box plot?
In this guide, first sort the data and find its median. Find Q1 as the median of the lower half and Q3 as the median of the upper half; when the sample size is odd, exclude the overall median from both halves. Other legitimate quartile methods also exist.
What changes when there is an odd or even number of values?
With an even count, average the two middle observations to obtain the median. With an odd count, the one central observation is the median; this guide omits it from the two halves used to calculate Q1 and Q3.
How do you find potential outliers for a box plot?
Find IQR = Q3 − Q1. Calculate the lower fence Q1 − 1.5 × IQR and upper fence Q3 + 1.5 × IQR. In a modified plot, observations strictly outside the fences are flagged and drawn separately.
Where should the whiskers end?
In a traditional box plot, at the observed minimum and maximum. In a modified plot, at the smallest and largest observed values that are still inside the selected outlier fences, not automatically at the fence numbers.
Does the median line have to be in the center of the box?
No. Draw it at its numerical position between Q1 and Q3. Unequal distances to the quartiles can put it closer to one box edge.
Can a box plot have no outliers?
Yes. The eight-number example here has none under the 1.5 × IQR convention. A modified plot and a traditional plot then may have the same whisker endpoints.
Can I create a box plot online instead of drawing one?
Yes. Paste raw numerical values or a five-number summary into AmriData's Box Plot Maker. The raw-data method uses percentile interpolation, so check that convention when comparing it with this hand-calculated tutorial.
Key Takeaways
- For a hand-drawn box plot, sort first and find the median, Q1 and Q3 under one stated quartile method.
- The box covers Q1 to Q3; its length along the numerical axis equals the IQR.
- Traditional whiskers reach the observed minimum and maximum. Modified whiskers stop at observations inside the outlier fences.
- Fences are calculated thresholds, not necessarily actual observations or whisker endpoints.
- Keep the number-line scale proportional, label your units and investigate flagged points before excluding them.
Once you know how to make a box plot by hand, you can check a software result instead of guessing what its whiskers mean. For other ways to display numbers, visit the Data Visualization category or browse the AmriData blog.
Related Data Visualization Guides and Tools
- Data Visualization guides — return to the main chart-making category
- Box Plot Maker — paste data, compare groups and download a chart
- How to Choose the Right Chart Type — decide whether a box plot answers your question
- Histogram Explained — inspect numerical distributions in more detail
- Mean, Median and Mode — review ways to describe the center
- Standard Deviation Explained — understand another measure of spread
- Exploratory Data Analysis Steps — use plots as part of a larger data-checking process
← Back to all Data Visualization articles
Statistical References
- NIST/SEMATECH e-Handbook — Box Plot. Basic box-plot construction and grouped comparisons.
- OpenStax, Introductory Statistics 2e — Box Plots. The five-number summary, scaled axes and alternative treatment of outliers.
- AmriData Box Plot Maker — Calculation Documentation. The tool's p × (n − 1) quartile method, 1.5 × IQR whiskers and summary-only input mode.