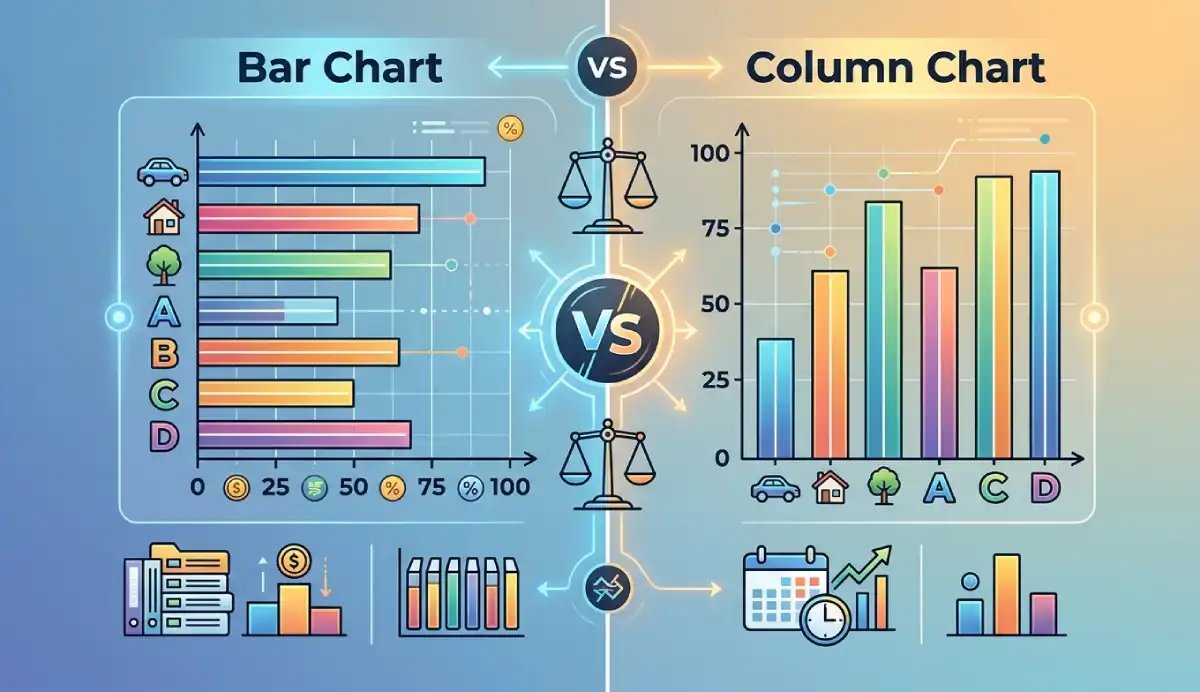
Bar chart vs column chart: both display numerical values across discrete categories — the difference is orientation. A bar chart places categories on the vertical axis and extends bars horizontally. A column chart places categories on the horizontal axis and extends columns vertically. Choose horizontal bars when labels are long, there are many categories, or ranking is the message. Choose vertical columns when labels are short, there are few categories, or left-to-right order carries meaning.
The worked examples throughout this guide use the same product dataset — Alpha 42, Beta 31, Gamma 55, Delta 28 — in both orientations so you can see that rotating the chart changes layout, not the values. This guide is part of the Data Visualization category.
To build either chart online, open the free AmriData Bar Chart Maker (horizontal) or the Column Chart Maker (vertical). Both support grouped and stacked variants and PNG/SVG export.
What Is the Difference Between a Bar Chart and a Column Chart?
Quick answer: The main difference between a bar chart and a column chart is orientation. A bar chart usually places categories on the vertical axis and extends bars horizontally, while a column chart places categories on the horizontal axis and extends columns vertically. Both compare numerical values across discrete categories. Choose horizontal bars when labels are long, there are many categories, or ranking is important. Choose vertical columns when labels are short, there are relatively few categories, or the horizontal order carries meaning.
Bar Chart vs Column Chart at a Glance
| Feature | Bar chart | Column chart |
|---|---|---|
| Orientation | Horizontal | Vertical |
| Category axis | Vertical (y-axis) | Horizontal (x-axis) |
| Value axis | Horizontal (x-axis) | Vertical (y-axis) |
| Long labels | Usually easier to read | Can become crowded or rotated |
| Many categories | Often easier to fit | Columns become narrow |
| Rankings | Excellent — scan label → bar → value | Good |
| Short labels | Good | Excellent — compact and clean |
| Ordered periods (Q1–Q4, months) | Possible | Often more intuitive |
| Nominal variables (no natural order) | Preferred | Works |
| Ordinal variables (months, quarters, age ranges) | Possible | Usually more intuitive |
| Negative values | Bars extend left of zero | Columns extend below zero (more intuitive) |
| Grouped versions | Yes | Yes |
| Stacked versions | Yes | Yes |
| 100% stacked | Yes | Yes |
| Zero baseline required | Yes (for honest length encoding) | Yes (for honest height encoding) |
| Software name in Excel/Sheets | "Bar chart" | "Column chart" |
| Power BI name | "Clustered / Stacked bar chart" | "Clustered / Stacked column chart" |
Definitions
What Is a Bar Chart?
A bar chart displays categories along the vertical axis and numerical values along the horizontal axis, producing horizontal bars whose lengths represent the magnitude of each category. Readers scan from left (zero) to right (the bar's end) to read a value.
In everyday use, "bar graph" and "bar chart" mean the same thing. You will also hear people call a vertical chart a "bar graph" — particularly in schools and in general speech — because the term predates the software convention that separates horizontal from vertical. This guide follows the common software convention: bar = horizontal.
What Is a Column Chart?
A column chart displays categories along the horizontal axis and numerical values along the vertical axis, producing vertical columns whose heights represent magnitude. Readers scan from the base of each column upward to read the value.
"Column chart" and "column graph" are interchangeable, though most spreadsheet software uses "column chart." In many business contexts, a vertical bar chart is simply called a "bar chart" — which is why software terminology matters less than understanding the orientation you are describing.
Is a Column Chart the Same as a Bar Chart?
Conceptually, yes. A column chart is the vertical orientation of the same categorical comparison a bar chart makes. Both encode magnitude using length (or height), both require a zero baseline, and both answer the same question: how do numerical values compare across discrete categories?
Software manufacturers drew a naming line at orientation. Microsoft Excel and Google Sheets both use "Bar chart" for the horizontal version and "Column chart" for the vertical. In statistical textbooks and school curricula, "bar graph" often covers both — you may see "horizontal bar graph" and "vertical bar graph" used to be precise. The naming is a convention, not a difference in chart type.

Same Data, Both Orientations
Here is the same four-product dataset displayed as a horizontal bar chart and a vertical column chart. Nothing about the values or their meaning changes — only the layout does.
| Product | Units sold |
|---|---|
| Alpha | 42 |
| Beta | 31 |
| Gamma | 55 |
| Delta | 28 |
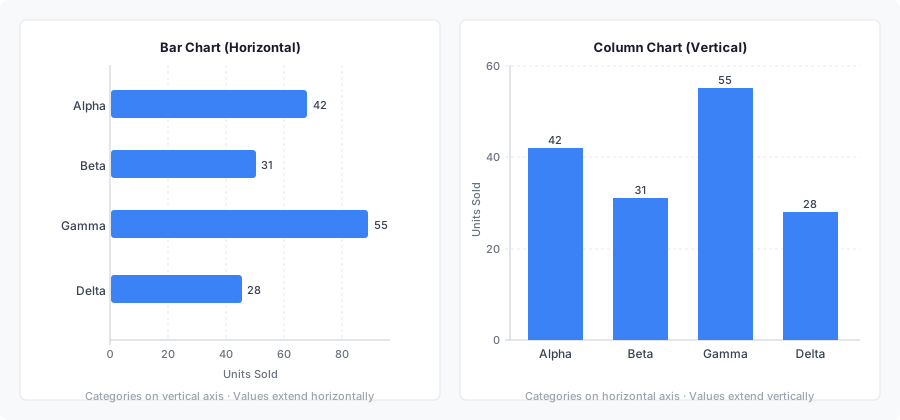
In both versions, Gamma is the highest-value product and Delta is the lowest. The bar lengths and column heights differ visually because the axes are swapped, but the underlying values are identical. Changing orientation does not change calculations, rankings, or analytical meaning.
Key principle: rotating a bar chart into a column chart does not change the values, the category order, the scale, or the meaning of the comparison. It changes readability and layout — which is exactly what you should be evaluating when choosing between the two.
When to Use a Bar Chart (Horizontal)
Horizontal bars have one structural advantage over vertical columns: the category labels sit on the vertical axis in their natural reading direction. They do not need to be rotated, abbreviated, or wrapped. That makes the bar chart the default choice for any data where labels or category count would cause readability problems in a column chart.
Long category labels
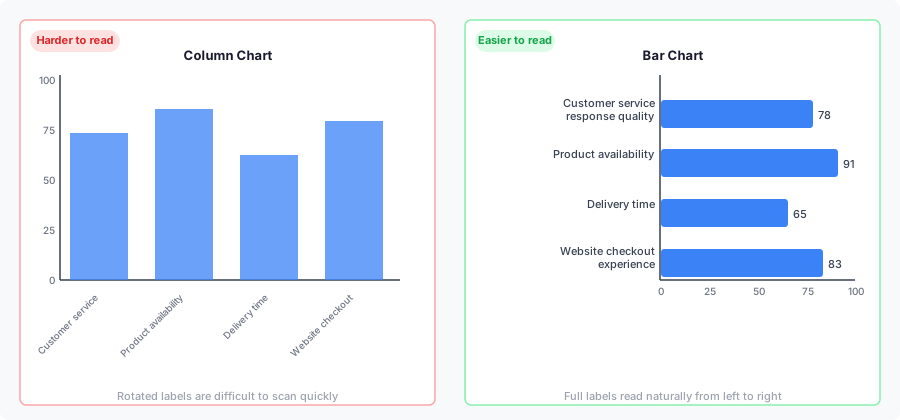
Consider survey response labels like "Customer service response quality," "Product availability," "Delivery time," and "Website checkout experience." A column chart would need to rotate these 45 degrees or stack them across multiple lines. A bar chart simply puts them on the vertical axis where they read naturally from left to right.
Rankings
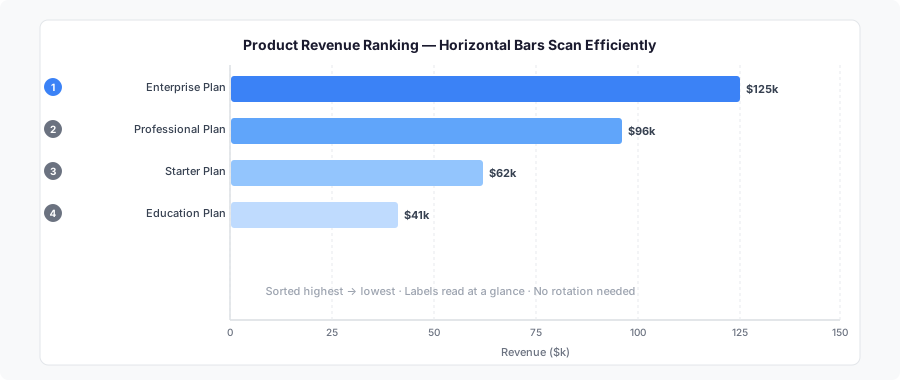
When the main message is "which is largest and which is smallest," sort the categories from largest to smallest and use a horizontal bar chart. The reader's eye travels from the category label at the left edge, along the bar, to the value at the right end — that left-to-right scan matches how text is read in most Western languages and is particularly efficient for ranked lists.
Many categories
Ten or twenty categories can fit on a horizontal bar chart by using the vertical dimension of the screen or page. The same twenty categories in a column chart produce narrow columns with overlapping or rotated labels. If you find yourself wrestling with label space on a column chart, rotate to horizontal bars.
Nominal variables (no natural order)
A nominal variable has no inherent order — favorite ice cream flavors, employment sectors, product names, survey response categories. Because the sequence is arbitrary, horizontal bars are preferred: you can sort from largest to smallest to highlight ranking, and the vertical axis handles any label length cleanly. This is the variable-type rule: when categories could appear in any order without losing meaning, use horizontal bars.
When to Use a Column Chart (Vertical)
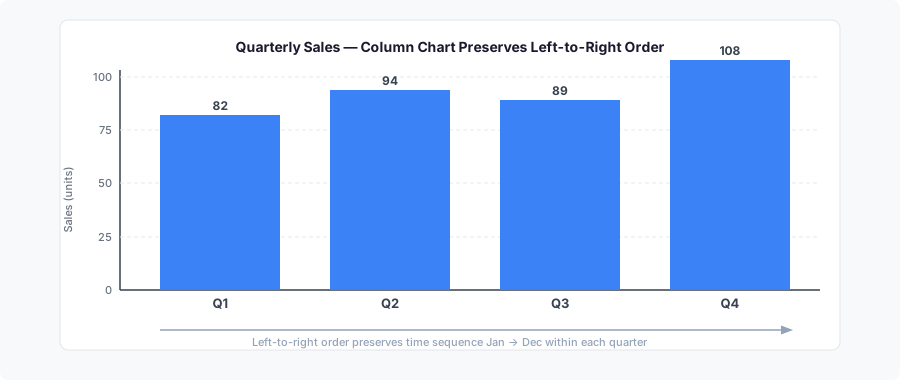
Vertical columns work well when category labels are short and left-to-right order carries meaning. They are also familiar in business settings — many audiences expect period-by-period comparisons to run left to right across a page or slide, in the same direction time flows.
Short labels and few categories
Labels like Q1, Q2, Q3, Q4 or North, South, West, East are compact enough to sit comfortably below a column without rotation. When there are four to eight categories with short names, either orientation works, but columns often feel cleaner.
Ordered (ordinal) categories
An ordinal variable follows a natural sequence: months, quarters, age ranges, salary bands, years, or before/after comparisons. Because readers expect ordinal categories to scan left to right, vertical column charts are the standard choice. Months running January through December, or cohorts from 2022 through 2026, carry inherent left-to-right temporal meaning that a column chart preserves.
Negative values
Column charts handle negative values more intuitively than bar charts. We naturally associate "negative" with "downward," so columns that extend below the zero line match that cognitive model. In a bar chart, negative values extend to the left of zero — a direction less instinctively read as negative. When your data includes both positive and negative values (such as profit/loss or year-over-year change), a column chart is usually the clearer choice.
Neither orientation is reserved for a particular data type. Column charts are not only for time, and bar charts are not only for rankings. Bars can show time periods; columns can rank categories. Orientation is a readability decision, not a data-type rule.
Nominal vs Ordinal: The Variable-Type Rule
The clearest framework for choosing orientation comes from variable type — a distinction from statistics that maps directly onto chart choice.
Nominal variables have categories with no natural order. Favorite ice cream flavors, employment sectors, product names, survey response labels — these can be arranged in any sequence without losing meaning. Because the order is arbitrary, horizontal bar charts are preferred. Sort from largest to smallest to emphasize ranking, and the vertical axis handles any label length cleanly.
Ordinal variables follow a natural sequence. Age ranges (0–10, 10–20, 20–30), salary bands, quarters Q1–Q4, months January–December, graduating cohorts, and before/after comparisons all have an inherent order readers expect to scan left to right. Use vertical column charts to preserve that natural sequence across the page.
This rule doesn't override readability. If an ordinal variable has very long labels or many categories, switching to horizontal bars for legibility is a reasonable trade-off. The rule is a starting point, not a constraint.
Bar vs Column for Negative Values
Both orientations can display negative values, but column charts handle them more intuitively. We naturally associate "downward" with negative, so columns that extend below the zero baseline match that cognitive model. Bar charts show negative values as bars extending to the left of zero — a direction that feels less instinctively negative to most readers.
When your dataset includes profit/loss figures, temperature changes, or any signed metric with both positive and negative values, default to a column chart. Mark the zero reference line clearly so readers can distinguish positive columns from negative ones at a glance.
Bar vs Column for Time Data
The choice between bar and column for time data comes down to label length and the number of periods. Monthly totals labeled "Jan," "Feb," "Mar" are short enough for a column chart and the left-to-right sequence feels intuitive. Twelve months of data labeled with full names — "January," "February," "March" — might scan more easily as horizontal bars, though many designers abbreviate to keep columns viable.
One more consideration: if the primary question is continuous trend across many time points rather than the exact total for each period, a line chart often communicates more clearly than either orientation of a bar chart. Bar and column charts work best when the question is "how much did each period produce?" rather than "how did the value progress from start to finish?" See the guide on how to make a line graph for the trend-emphasis case.
Grouped and Stacked Variants
Grouped bar vs grouped column
A grouped chart places multiple series side by side for each category. The choice between horizontal and vertical remains a readability decision — the same logic applies. Long category names with multiple series favor horizontal grouped bars. Short category names with a modest number of series can work well as grouped columns.
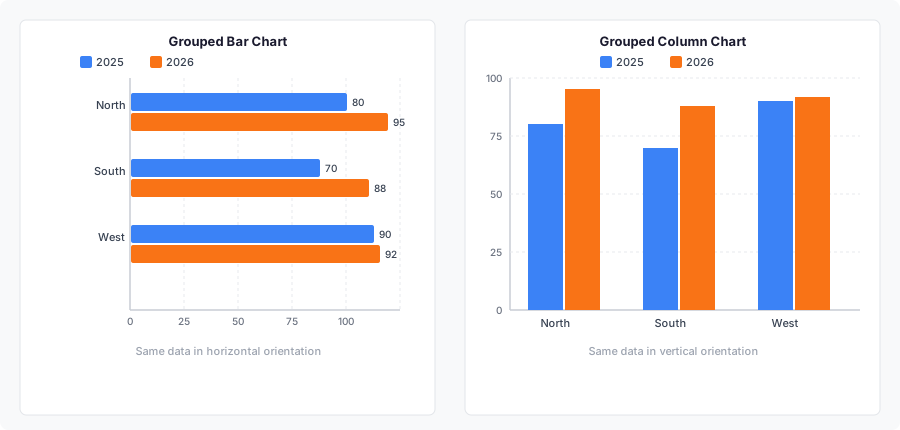
Grouped charts have practical limits. More than three or four series per category creates crowding regardless of orientation. When grouping stops working, consider small multiples — one chart per series — or filtering to the series that directly answers the question.
Stacked bar vs stacked column
Stacked charts add segments within each bar or column to show component contributions to a category total. Again, only orientation changes. Horizontal stacked bars are often useful when category names are long. Vertical stacked columns work well for a small number of ordered categories like quarters.
One shared limitation: segments that are not anchored at the shared zero baseline are harder to compare precisely across categories. If comparing individual component sizes is important, grouped charts or small multiples are easier to read than stacked ones.
100% stacked charts
Both orientations support a 100% stacked version, where each bar or column is normalized so all reach the same total length or height. This shows proportional composition rather than absolute magnitude. The trade-off is that you lose the ability to compare totals across categories — two bars of equal length may represent very different actual totals. Include sample sizes or total counts in captions when the absolute magnitude matters to the reader.
Bar Chart vs Column Chart in Excel and Google Sheets
In Microsoft Excel
Excel separates bar and column into two distinct chart types under Insert → Insert Column or Bar Chart. Its current documentation describes bar charts as suited to data with long axis labels or values that are durations. Column charts are the vertical alternative. Both support 2-D, grouped, stacked, and 100% stacked subtypes. Excel's 3-D variants are worth avoiding — perspective distorts the apparent height or length of bars without adding information.
When numeric spacing between x-values matters — for example, measurements taken on days 1, 2, and 20 — a standard Excel line or column chart treats those x-values as equally spaced categories, which misrepresents the gap between days 2 and 20. In that situation, use an XY scatter chart instead. For more on Excel chart types and data analysis workflows, see the Excel data analysis guide.
In Google Sheets
Google Sheets similarly separates "Bar chart" (horizontal) and "Column chart" (vertical) as distinct options under Insert → Chart. Its documentation describes bar charts as good for comparing individual items and column charts as useful for comparing categories and showing changes over time. The Smooth line chart option available in Sheets applies only to line charts — it does not convert a column chart into a smoothed trend.
In both applications, the first column of your data range becomes the category labels. Whether those labels appear on the vertical axis (bar chart) or the horizontal axis (column chart) depends on which chart type you select — the data layout is identical either way.
For a quick online result without a spreadsheet, the AmriData tools handle axis setup, scaling, and export automatically. Bar Chart Maker → Column Chart Maker →
Bar Chart vs Column Chart in Power BI
Power BI uses slightly different naming but the same horizontal/vertical logic. Under the Visualizations pane:
- Clustered bar chart and Stacked bar chart produce horizontal bars. Categories appear on the Y-axis; values on the X-axis.
- Clustered column chart and Stacked column chart produce vertical columns. Categories appear on the X-axis; values on the Y-axis.
The same decision rules apply: use bar (horizontal) in Power BI for long category labels, many categories, or nominal data you want sorted by value. Use column (vertical) for ordered time periods, short labels, and data with negative values. For trend analysis across many time points, the Line chart or Area chart visuals are better choices than a column chart with many x-axis categories.
Bar/Column vs Other Chart Types
Bar or column chart vs line chart
A bar or column chart emphasizes the magnitude of individual discrete values. A line chart emphasizes progression and trend across a continuous sequence. Twelve monthly revenue values could reasonably appear as either — columns work better when readers need the exact monthly total, while a line chart works better when the overall trend direction is the message. For a step-by-step construction guide, see how to make a line graph.
Bar or column chart vs histogram
Histograms can look like column charts because their bins are also drawn as vertical rectangles. The difference is conceptual: a histogram represents the distribution of a continuous numeric variable divided into intervals (age groups 0–10, 10–20, 20–30), while a bar or column chart represents distinct named categories (North, South, West). The bins of a histogram touch each other because the underlying variable is continuous; the bars of a column chart have gaps because the categories are separate. See histogram vs bar graph for a full comparison.
Bar or column chart vs pie chart
Use a pie chart only when you need to show parts of a whole and the number of segments is small (ideally 2–4). Bar and column charts handle part-to-whole comparisons better than pies when there are more than four categories, because bar lengths are easier to compare accurately than arc angles.
Which chart type to choose overall
For the full decision framework covering scatter plots, pie charts, area charts, and more, see how to choose the right chart type.
Common Mistakes
Most mistakes with bar and column charts fall into one of three groups: claiming orientation implies data-type differences, ignoring readability problems, or breaking axis rules that apply equally to both.
Treating the two as fundamentally different chart types
Both charts make the same categorical comparison. Claiming that "bar charts are for categories but column charts are for time" is wrong — columns are used for ordered categories, rankings, and ordinary nominal categories; bars can and do show time periods. The difference is orientation, not semantics.
Ignoring long labels in column charts
Rotating labels 45 or 90 degrees makes them harder to read. If you find yourself rotating labels, that is a signal to switch to a horizontal bar chart rather than a reason to keep a column chart.
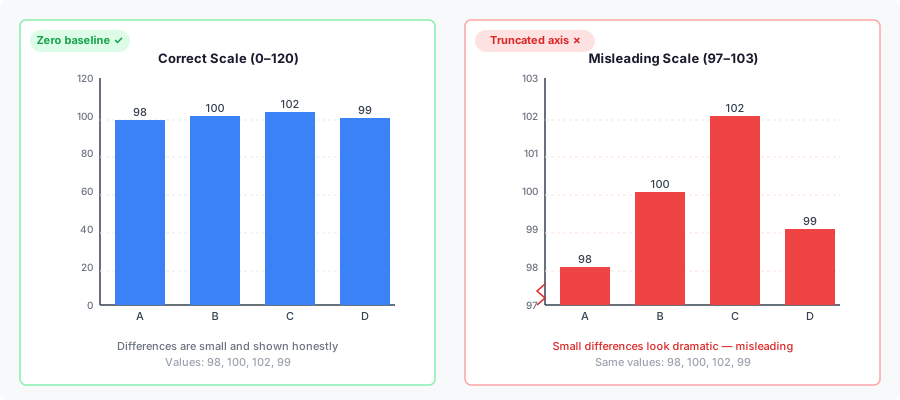
Truncating the value axis
Because both chart types encode magnitude through bar length or column height, the value axis should normally begin at zero for straightforward comparisons. A truncated axis makes small differences appear large.
Sorting time or ordinal categories by value
Months or quarters must run in chronological order. Survey scales from "Strongly disagree" to "Strongly agree" must preserve the logical order. Sorting these categories by their values answers a different question and removes the meaningful sequence from the chart.
Confusing a column chart with a histogram
Vertical bins for age distributions or income ranges look like columns but represent a fundamentally different data structure. See the histogram vs bar graph article for the full distinction.
Using too many grouped series
Orientation cannot rescue a chart with six series per category group. When grouping becomes unreadable, reduce the series count or use small multiples. For a broader list of visualization errors across chart types, see data visualization mistakes.
Which Should You Use? Decision Checklist
Run through these questions before committing to an orientation. The first clear "yes" points you in a direction.
Choose a bar chart when…
- Category labels are long
- There are many categories (10+)
- Ranking is the primary message
- Data is nominal (no natural order between categories)
- Left-to-right order doesn't matter
- Vertical scrolling is acceptable
- Readers need to scan label → value quickly
Choose a column chart when…
- Category labels are short
- There are few categories (2–8)
- Left-to-right order carries meaning
- Data is ordinal (months, quarters, age ranges, before/after)
- Dataset includes negative values
- Displaying periods (months, quarters)
- Audience expects a conventional layout
- Container is wider than it is tall
If neither set of conditions clearly applies — say, five categories with medium-length labels — either orientation will work. Build both, look at both at final output size, and keep the one that communicates more clearly. These are readability heuristics, not hard rules, and orientation never changes the underlying values.
Frequently Asked Questions
Are "bar chart" and "column chart" the same thing?
Conceptually yes — both compare numerical values across discrete categories using the length of a rectangle. Software terminology distinguishes them by orientation: bar = horizontal, column = vertical. In everyday speech, "bar graph" can refer to either.
Why does my software call the vertical one a "bar chart"?
Some tools and educational materials use "bar graph" or "bar chart" for any chart with rectangular bars, regardless of orientation. The horizontal/vertical distinction in this guide reflects the terminology used by Microsoft Excel and Google Sheets, which is the most widely followed software convention.
Does changing orientation change the data?
No. Rotating a chart changes layout and readability, not values. Gamma = 55 in a horizontal bar chart is still 55 in a vertical column chart. The only things that change are which axis carries the categories and which carries the values.
Which orientation works better for long category labels?
Horizontal bars. Category labels sit on the vertical axis and read naturally from left to right, with no need for rotation, abbreviation, or wrapping. Long labels in a column chart typically need to be rotated 45 or 90 degrees, which slows reading.
Which is better for ranking?
Horizontal bar charts. Sort from largest at the top to smallest at the bottom. The reader scans category name → bar length → value efficiently, in the same direction they read text.
Can I use a column chart for time data?
Yes. Short time labels like Q1–Q4 or abbreviated months work well in a column chart, and the left-to-right sequence matches how most people read time. For continuous trend emphasis across many time points, consider a line chart instead.
Is a column chart only for time data?
No. A column chart can compare any discrete categories — products, regions, departments, age groups. Time data is a common use because the left-to-right layout feels intuitive for chronological sequences, but it is not a requirement.
Do both chart types require a zero baseline?
Yes, for standard magnitude comparisons. Both encode values through the length (or height) of the bar or column. Starting the value axis above zero exaggerates small differences and misleads readers about the relative size of categories.
Can bar and column charts show negative values?
Yes. Bars extend to the left of zero; columns extend below zero. Mark the zero reference line clearly so readers can distinguish positive from negative values. Column charts are generally preferred for negative values because downward naturally reads as negative to most audiences.
Is a histogram the same as a column chart?
No. A histogram represents the frequency distribution of a continuous numeric variable divided into intervals. A column chart represents distinct named categories. They look similar but mean different things. See the histogram vs bar graph article for a full comparison.
How does Excel distinguish bar and column charts?
In Excel, the "Bar chart" type produces horizontal bars (categories on the vertical axis, values on the horizontal axis). The "Column chart" type produces vertical columns (categories on the horizontal axis, values on the vertical axis). Both are found under Insert → Insert Column or Bar Chart.
How does Google Sheets distinguish bar and column charts?
Google Sheets uses the same convention: "Bar chart" is horizontal, "Column chart" is vertical. Select your data, click Insert → Chart, and choose the type from the chart editor panel.
What is the difference between a bar chart and a column chart in Power BI?
In Power BI, "Clustered bar chart" and "Stacked bar chart" are horizontal (categories on the Y-axis, values on the X-axis). "Clustered column chart" and "Stacked column chart" are vertical (categories on the X-axis, values on the Y-axis). The same readability rules apply: use horizontal bar visuals for long labels or nominal data; use vertical column visuals for ordered periods or negative values.
When should I use the nominal vs ordinal rule to pick an orientation?
Use it as a starting point: nominal variables (no natural order, e.g. product names, job titles, survey categories) → horizontal bar chart. Ordinal variables (natural sequence, e.g. age ranges, months, Likert scales) → vertical column chart. If readability considerations — long labels or many categories — point the other way, follow readability. The rule aids the choice; it does not override common sense.
Can both be grouped or stacked?
Yes. Both bar and column charts support grouped, stacked, and 100% stacked variants. The orientation choice and the grouping/stacking choice are independent decisions.
Which AmriData tool creates horizontal bars and which creates vertical columns?
The Bar Chart Maker creates horizontal bar charts and also supports a vertical orientation switch. The Column Chart Maker creates vertical column charts. Both support grouped and stacked variants, manual data entry, spreadsheet paste, CSV/TSV import, and PNG/SVG export.
Key Takeaways
- A bar chart and a column chart show the same type of categorical comparison. Orientation — horizontal versus vertical — is their only structural difference.
- In common software terminology: bar = horizontal, column = vertical. In everyday speech, "bar graph" can mean either.
- Horizontal bars work best when labels are long, there are many categories, data is nominal, or ranking is the message.
- Vertical columns work best when labels are short, data is ordinal (months, quarters, age ranges), left-to-right sequence carries meaning, or the data includes negative values.
- Rotating a chart changes readability, not values. Gamma = 55 stays 55 regardless of orientation.
- Both chart types require a zero baseline for honest magnitude comparisons, because they encode values through bar length or column height.
- Column charts handle negative values more intuitively — downward naturally reads as negative to most audiences.
- Column charts are not only for time data, and bar charts are not only for categories. Both can serve either purpose.
- A histogram may look like a column chart, but they represent different things: histograms show continuous distributions; column charts show discrete categories.
- Grouped and stacked variants exist for both orientations. The readability rules are the same.
- In Power BI, "bar chart" = horizontal; "column chart" = vertical — the same naming convention as Excel and Google Sheets.