
How to make a line graph: arrange your observations in meaningful order, place the ordered variable — usually time — on the horizontal axis and the measured value on the vertical axis. Choose readable scales, plot each observation at its correct position, then connect consecutive points when the sequence between them is meaningful. Add a descriptive title, axis labels and units. If time intervals are unequal, preserve their actual spacing or clearly explain that the graph uses equal positions.
Our worked example uses synthetic weekly website visits: 120, 145, 138, 170, 185 and 178 over six consecutive weeks. The same values appear in the table and graphs so you can check each step. This tutorial belongs to the Data Visualization category.
For a quick result, open the free AmriData Line Graph Maker. It supports ordered data, multiple series and PNG or SVG export.
How Do You Make a Line Graph?
- Organize observations in their correct chronological or logical order.
- Put time or another ordered variable on the x-axis and measurements on the y-axis.
- Choose scales that preserve meaningful time spacing and show the full value range.
- Plot each observation accurately and connect consecutive points in order.
- Add a descriptive title, axis labels, units and a legend when needed.
What Is a Line Graph?
A line graph displays numerical values at ordered positions and connects successive data points with lines. Time is the most common horizontal variable, which makes line graphs useful for showing how a measurement rises, falls or stays stable over a sequence.
The terms line graph and line chart describe the same thing and are used interchangeably. Some software adds the term line plot, but be careful: in certain educational and statistical contexts "line plot" means something else entirely — a dot-plot-style display of individual values along a number line. This guide uses line graph and line chart throughout.
When to Use a Line Graph
A line graph is appropriate when your observations have a meaningful order and the change between successive positions is what you want to communicate. Common situations:
| Use a line graph when… | Consider another chart when… |
|---|---|
| Data is time-series or has a meaningful sequence | Categories are unrelated and have no natural order → bar chart |
| Change between successive observations matters | Main question is distribution of individual measurements → histogram |
| Multiple series share comparable x positions | You're comparing two unrelated numeric variables → scatter plot |
| Trend or trajectory is the message | Individual period totals matter most → column chart |
For a complete decision framework, see how to choose the right chart type.
How to Make a Line Graph in 5 Steps
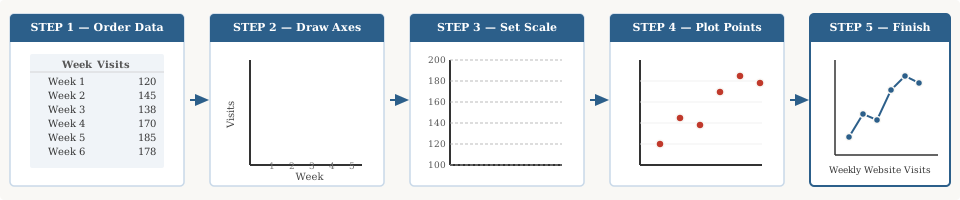
- Put the data in meaningful order.
- Create and label the x- and y-axes.
- Choose appropriate scale and spacing.
- Plot each data point and connect consecutive observations.
- Add the title, units, legend and final checks.
Step 1 — Put the Data in Meaningful Order
Line graphs depend on sequence. A line graph of monthly revenue must run January → February → March. Sorting months alphabetically or from highest to lowest revenue destroys the time sequence and makes the chart meaningless.
For the teaching example used throughout this guide — weekly website visits — the correct order is:
| Week | Visits |
|---|---|
| Week 1 | 120 |
| Week 2 | 145 |
| Week 3 | 138 |
| Week 4 | 170 |
| Week 5 | 185 |
| Week 6 | 178 |
The weeks have a natural chronological order, so a line graph is appropriate. Never reorder them by visit count — that would answer a different question entirely.
Step 2 — Create and Label the Axes
For a typical time-series line graph, the horizontal (x) axis carries the ordered variable and the vertical (y) axis carries the numerical measurement.
For this example: x-axis = Week, y-axis = Website visits.
Label both axes so readers know exactly what they're looking at. If values have units — revenue in dollars, temperature in degrees Celsius, response time in milliseconds — include those units on the axis or in the label.
Step 3 — Choose the Scale and Time Spacing
A useful scale should contain every observation, use consistent numerical intervals, and remain easy to read. For this example, a y-axis running from 100 to 200 in steps of 20 covers all six values (120–185) without wasted space at the top.
For x spacing: because the six weeks are consecutive and equally spaced in real time, equal horizontal spacing is appropriate here. When dates are irregular — see the unequal time intervals section below — that choice requires more thought.
Step 4 — Plot Each Data Point and Connect Consecutive Observations
Find each observation's x position and y value, then mark a point. Week 1 lands at (Week 1, 120); Week 2 at (Week 2, 145); and so on through Week 6.
Connect the points in sequence — not by value rank. The line runs Week 1 → Week 2 → … → Week 6, regardless of which week had the highest or lowest count.
Important: the straight segment between two observations is a visual connection, not a record of every intermediate value. It does not prove the measurement followed that exact path between the two recorded moments.Step 5 — Add the Title, Units and Legend
A title that says only "Line Graph" tells the reader nothing. Compare:
- Weak: Line Graph
- Better: Weekly Website Visits, Six-Week Example
For a single line, a legend is often unnecessary when the title and axis labels identify the measurement. For two or more series, add a clear legend or label each line near its endpoint.
Before calling it done, verify: correct sequence, matching values, readable scale, labeled axes, units included, and a descriptive title.
Complete Worked Example
Here is the weekly visits table turned into a finished chart, applying all five steps.
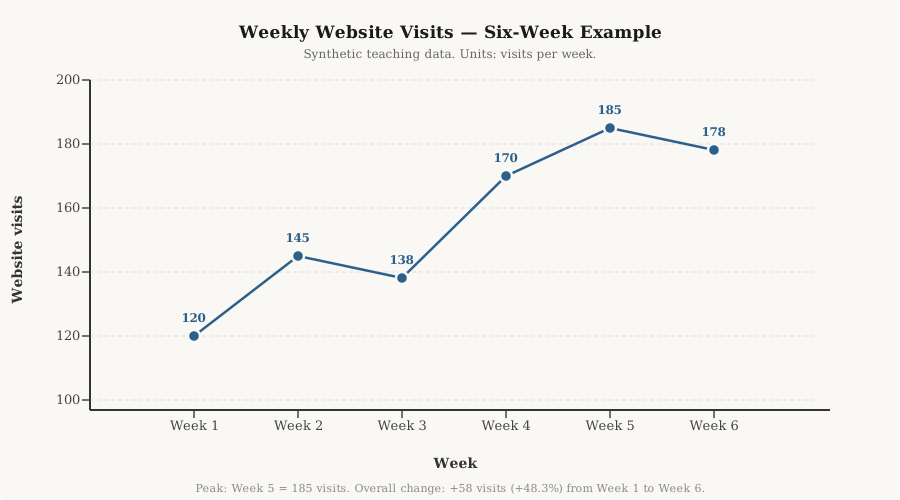
The data show visits of 120, 145, 138, 170, 185 and 178 across six consecutive weeks. Visits increased overall from 120 in Week 1 to 178 in Week 6, but the path was not continuously upward. Visits fell from Week 2 to Week 3 and again from Week 5 to Week 6.
The peak was Week 5 at 185. The first-to-last increase was 58 visits, or about 48.3% relative to the Week 1 figure. That is the change from the first to the last observation — not a per-week growth rate.
How to Make a Line Graph Online With AmriData
The AmriData Line Graph Maker handles axis setup, scaling and export so you can focus on the data. Current features include manual entry, spreadsheet paste, CSV/TSV import, multiple series (up to six), equal or actual-date horizontal spacing, point-marker customization, PNG export, SVG export and data CSV export. Chart processing happens inside the browser — your standalone graph data are not uploaded to AmriData.
- Open the Line Graph Maker at amridata.com/tools/line-graph-maker.
- Enter your data. Type ordered labels and values directly, paste a table from a spreadsheet, or upload a CSV/TSV file.
- Add more series if you want a multiple-line graph. Each series becomes a separate line.
- Add a chart title and customize axis labels, markers and spacing.
- Choose spacing: equal positions for regularly spaced categories, or actual-date intervals when elapsed time matters.
- Check the preview. Confirm sequence, values and scale.
- Export as PNG, SVG or data CSV.
How to Make a Line Graph by Hand
Drawing on paper forces you to think through every decision deliberately, which is a useful exercise even if you normally rely on software.
- Write down your values in the correct sequence.
- Draw a horizontal axis and a vertical axis meeting at a corner.
- Label both axes: x-axis with the ordered variable, y-axis with the measured value.
- Choose a readable scale for the y-axis. Mark equal tick intervals that cover your full range.
- Mark each x position at equal horizontal spacing (or proportional to real elapsed time if intervals differ).
- Plot each value as a point at its correct x position and y height.
- Connect the points in order with straight segments.
- Write a descriptive title. Add units to the y-axis.
- Check: sequence correct, all values plotted, scale readable, axes labeled.
Graph paper makes consistent spacing and scaling much easier, though it isn't strictly necessary. A ruler keeps your connecting lines straight.
How to Make a Line Graph in Excel
In Excel, a standard line chart plots x labels as equally spaced categories. If the numeric distance between your x-values matters — for example, measuring at days 1, 2 and 20 — you may need an XY Scatter chart instead. See the line vs scatter section below for that distinction.
- Put ordered x labels or dates in one column and numerical values in the adjacent column. Include a header row.
- Select the data range, including headers.
- Open the Insert tab on the ribbon.
- Click Insert Line or Area Chart in the Charts group.
- Choose Line or Line with Markers for a two-dimensional chart. Avoid 3-D options — they distort the line's apparent position without adding information.
- Add or edit the chart title: click the default placeholder and type your own.
- Add axis titles via Chart Elements (the + button near the chart).
- Check the value axis minimum: right-click the y-axis → Format Axis and confirm the bounds. Unlike bar charts, you do not always need zero — but document your choice.
For broader Excel work including PivotTables and formulas, see the Excel data analysis guide.
Should you use a Line Chart or Scatter Plot in Excel?
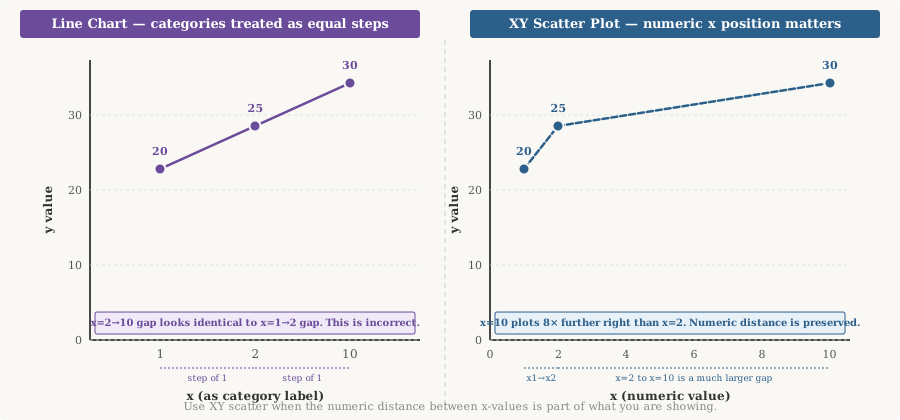
This distinction matters. In a standard Excel line chart, x values are treated as category labels and appear at equal visual spacing — regardless of their numeric values. In an XY scatter chart, both x and y positions are numeric, so the true distance between x-values is preserved.
Consider x-values of 1, 2 and 10. A line chart places all three at equal horizontal intervals. A scatter chart places 10 far to the right of 2, correctly reflecting the gap. When numeric x-spacing is part of the story, use XY scatter — not a line chart.
How to Make a Line Graph in Google Sheets
Google Sheets positions its line chart as a tool for finding trends in data over time. The current workflow:
- Enter ordered labels or dates in the first column and numerical series in additional columns. Add header labels in row 1.
- Select the data range.
- Click Insert → Chart. The chart editor panel opens on the right.
- Under "Chart type," choose Line chart.
- Open the Customize tab to add a chart title, axis titles and adjust the axis range.
- For multiple lines, each numeric column in your data range becomes a separate series in the chart.
- Verify the data range and that the sequence is correct before closing the editor.
Google Sheets also supports a Smooth line chart option. Use it only when you want a display transformation for aesthetic reasons — not to imply that the smoothed curve represents your raw data.
Double and Multiple Line Graphs
A double line graph places two series on the same chart measured across the same ordered x positions. A multiple line graph extends that to three or more series. Nothing structurally changes — you still plot each series against the same x positions and connect each series' points in order.
| Month | Product A | Product B |
|---|---|---|
| Jan | 120 | 95 |
| Feb | 135 | 100 |
| Mar | 128 | 110 |
| Apr | 150 | 125 |
| May | 162 | 130 |
| Jun | 175 | 145 |
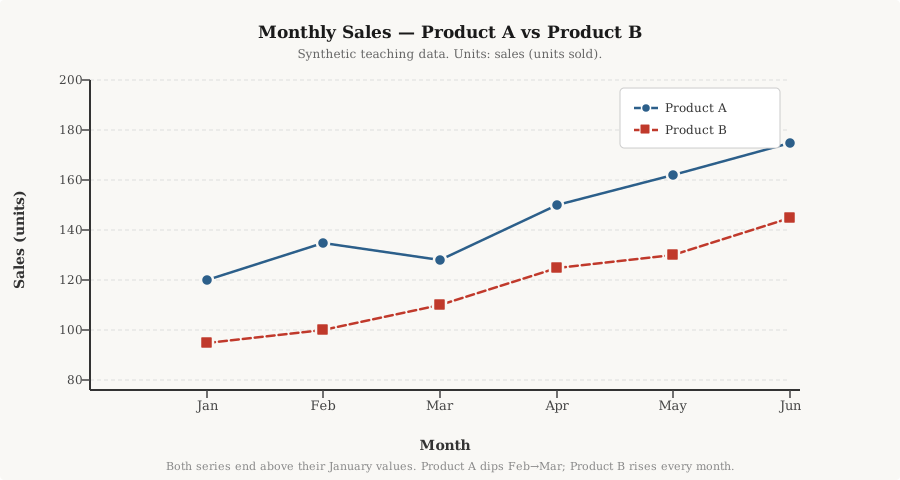
Both series end above their January values. The chart does not tell us why Product A's sales dipped in March — only that they did. Two lines moving in similar directions does not mean one caused the other.
How Many Lines Is Too Many?
The AmriData Line Graph Maker supports up to six series technically, but six overlapping lines often becomes unreadable — sometimes called a spaghetti chart. When that happens, consider showing fewer series, using small multiples, or highlighting only the lines that answer the core question.
When lines share a common scale and comparable x positions, multiple series work well. Never place series on the same line chart when they use different units — revenue in dollars and customer count as a number don't belong on one y-axis.
How to Handle Unequal Time Intervals
Equal horizontal spacing implies equal elapsed time. If your observations occur on Jan 1, Jan 2, Jan 20 and March 1, placing those four dates at equal visual intervals misrepresents the rate of change: the gap from Jan 2 to Jan 20 is 18 days, but the gap from Jan 20 to March 1 is 40 days. Drawn equally, both look identical.
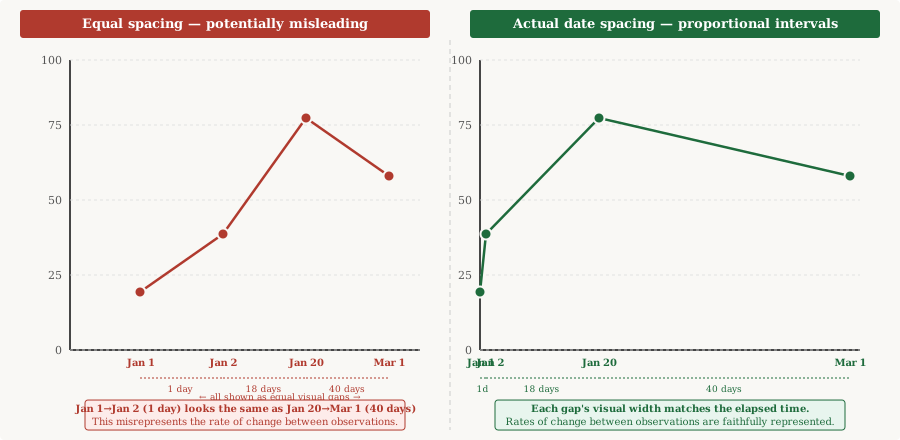
Two situations where equal spacing is still valid:
- The x variable is an ordered label rather than a date — "Visit 1, Visit 2, Visit 3" — where clock time between visits isn't the point.
- You are comparing regular calendar periods (Jan, Feb, Mar) where the goal is trend across standardised periods rather than elapsed days.
The AmriData Line Graph Maker supports both equal spacing and actual-date intervals. Whichever you choose, make sure the x-axis label makes the treatment clear to readers. A missing month should be annotated or shown as a gap — not silently skipped in a way that implies continuity.
Does a Line Graph Need to Start at Zero?
Unlike bar charts, line graphs do not always need a zero baseline. A bar chart uses bar length to represent magnitude, so cutting the baseline exaggerates differences in a way that misleads. A line graph uses point position, not length — so a y-axis starting above zero can be analytically valid.
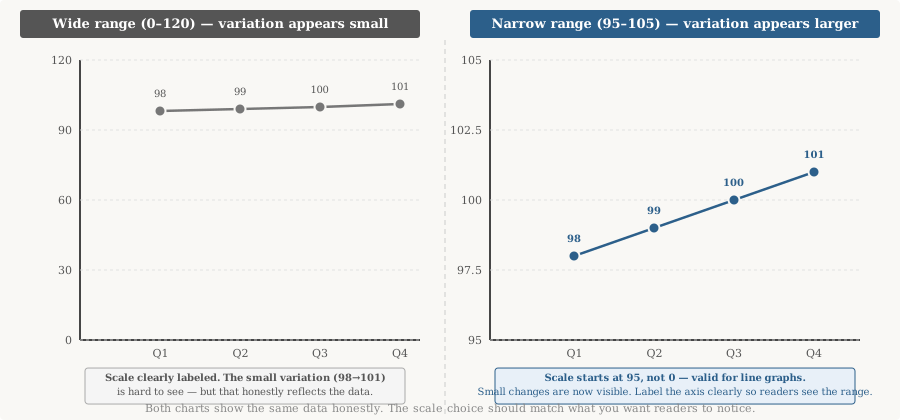
A narrower y-axis range can make genuine small changes visible. But it can also make trivial variation appear dramatic. The test is honest labeling: the displayed scale must be clearly visible, and you shouldn't crop the axis specifically to exaggerate changes that a reasonable reader would consider minor.
Ask: would a reasonable reader interpret the magnitude differently if the scale were broader? If yes, show both views or add context in the title or a note.How to Handle Missing Data
Missing does not mean zero. A zero value means a measurement was taken and the result was zero. A missing value means no measurement was recorded — perhaps the data weren't collected, were lost or are simply unknown.
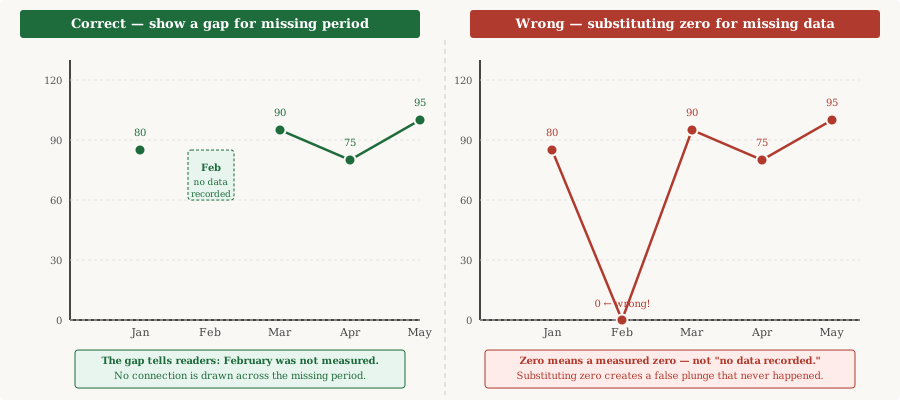
When connecting across a missing period, be careful: a line from January directly to March can make readers assume a continuous measured trend through February. Options to handle this honestly:
- Show a visible gap in the line for the missing period.
- Annotate the chart to note the missing period explicitly.
- If you do draw a dashed connection across the gap, label it clearly as an interpolation, not an observation.
Line Graph vs Scatter Plot
A line graph works best when your observations form a meaningful sequence — most often time. The line communicates progression through that sequence.
A scatter plot works best when the question is about the relationship between two numeric variables, neither of which is necessarily "ordered" in a temporal sense. Consider: does height relate to weight across a group of people? A scatter plot is the right tool, not a line graph — connecting each person to the next makes no sense.
The practical Excel distinction matters too: a standard line chart treats x values as category labels at equal spacing. An XY scatter chart respects the numeric distance between x-values. If you measured something at 1m, 2m and 10m along a path, a scatter chart places the 10m point far to the right where it belongs. See the Excel section above for a visual comparison.
Line Graph vs Bar/Column Chart
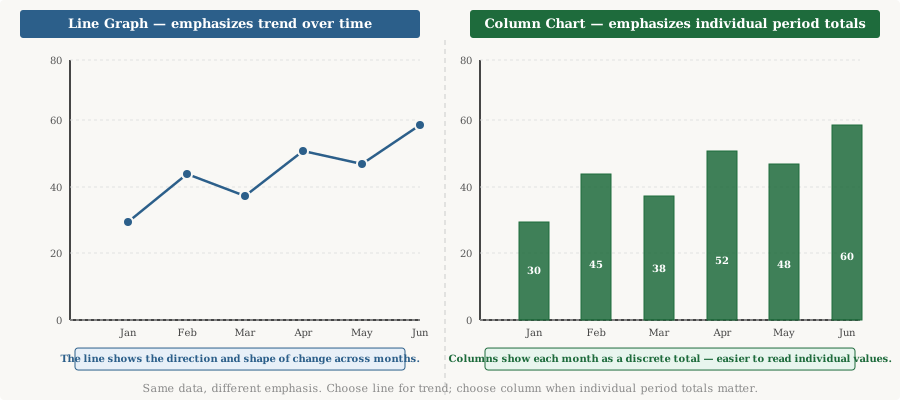
Line graphs emphasise progression through a meaningful order. Column charts emphasise the magnitude of individual discrete periods. When time is the x variable and you want readers to read a trend, a line graph is usually clearer. When individual period totals need to stand on their own — budget vs actual, monthly revenue by quarter — columns often work better.
Bar charts (horizontal bars) are best for comparing separate categories that have no natural order, such as countries by population or products by revenue. Connecting unrelated categories with a line is a common mistake — see the mistakes section. Use the Bar Chart Maker for those cases.
How to Choose Markers, Labels and Scales
Point markers
Markers identify the actual observed positions. They help readers distinguish individual data points from the interpolated segments between them. Use them when there are relatively few observations and exact positions matter. With many dense data points — daily readings across five years, for instance — markers create clutter that obscures the trend. Remove or reduce them in that case.
Line colors and multiple series
For a single series, one consistent line color is all you need. For multiple series, use different colors to distinguish lines — but never rely on color alone. Add distinct marker shapes or line patterns (solid, dashed, dotted) so readers who cannot distinguish colors can still identify each series. Direct labels placed near line endpoints can replace a legend entirely when space allows.
Dual y-axes
Two series with different units on the same chart — say, revenue (dollars) and customer count — require two y-axes. Dual axes can work but carry a real risk: the apparent alignment of two lines depends almost entirely on how you choose the two scales. Unrelated series can be made to look correlated, or genuinely correlated series can be made to look unrelated. Use dual axes cautiously, consider showing separate aligned charts instead, and never infer that two similarly shaped lines indicate a causal relationship.
Smoothed lines and trendlines
A smoothed line is a display transformation — it does not represent additional observations. Label it as such. A trendline is not a forecast: it describes the mathematical fit to your observed data and does not automatically predict future values. Forecasting requires a documented method, stated assumptions and validation.
Common Line Graph Mistakes
For visualization errors across all chart types, see the guide on data visualization mistakes. These are the ones most specific to line graphs.
- Connecting unordered categories. USA → France → Japan → Brazil in alphabetical order connected by a line implies a progression that doesn't exist. Use a bar chart for unrelated categories.
- Sorting a time series by value. Reordering months from highest to lowest visits makes the chart look like a ranked comparison, destroying any time-based pattern.
- Equal spacing for unequal dates. Placing Jan 1, Jan 2 and March 1 at equal visual intervals misrepresents the rate of change between observations.
- Substituting zero for missing data. Missing means unknown, not zero. A false zero creates a dramatic dip that never happened.
- Connecting across missing periods without annotation. A line from January to March implies a measured February trend. Show a gap or annotate clearly.
- Misleading y-axis range. Cropping the axis to exaggerate small variation is deceptive. Label the scale clearly and provide context.
- Forcing every line graph to start at zero. Unlike bar charts, line graphs use position, not length. A nonzero start can be valid — just label it honestly.
- Too many lines. Six overlapping series with similar values often produces an unreadable tangle. Cut to the series that answer the core question.
- Color-only identification. Always combine color with markers, line patterns or direct labels for accessibility.
- Missing units. "185" means nothing without "website visits" or "$185,000."
- Mixing measurement frequencies. Daily totals and monthly totals on the same axis without aggregation misrepresent magnitude.
- Partial period at the end. A month with only 10 days of data will show a lower total than complete months. Label it "month-to-date."
- 3-D line graphs. Perspective distorts the apparent position of points without adding information. Avoid them.
- Claiming the line segment is an observed record. A straight segment between two points is a visual connection. It doesn't mean the measurement followed that exact path between the two observations.
- Treating correlation as causation. Two lines moving together doesn't prove one caused the other.
- Extending the line as a forecast. Simply extending the last segment into the future isn't forecasting. Forecasting requires a stated method and assumptions.
Practice Examples
Practice 1 — Daily Temperature
| Day | °C |
|---|---|
| Mon | 18 |
| Tue | 20 |
| Wed | 22 |
| Thu | 21 |
| Fri | 24 |
Plot this as a line graph. Which day was the warmest? Was the temperature change from Wednesday to Thursday a rise or a fall? Answer: Friday was warmest at 24°C. Temperature fell from 22°C to 21°C between Wednesday and Thursday.
Practice 2 — Store Comparison (Double Line Graph)
| Month | Store A | Store B |
|---|---|---|
| Jan | 50 | 40 |
| Feb | 55 | 52 |
| Mar | 48 | 60 |
| Apr | 62 | 58 |
Draw a double line graph. Which store had the stronger finish in April? Answer: Store A at 62 units vs Store B at 58 units. Note that Store B overtook Store A in March before Store A recovered in April.
Practice 3 — Irregular Dates
You have readings on Jan 1, Jan 3, Jan 15 and Feb 1. Should the x-axis positions be equally spaced or based on actual dates?
Answer: If the elapsed interval between readings is part of what you're showing — for instance, measuring how fast something changes — use actual date spacing. Jan 1 to Jan 3 is 2 days; Jan 3 to Jan 15 is 12 days; Jan 15 to Feb 1 is 17 days. Equal spacing would hide those differences.
Frequently Asked Questions
What is a line graph?
A line graph displays numerical values at ordered positions and connects successive data points with lines. It shows how a measurement changes across a sequence, most often over time.
Are line graph and line chart the same thing?
Yes. The two terms are used interchangeably. Some software labels the chart type "line chart," others "line graph" — they refer to the same display.
What are the parts of a line graph?
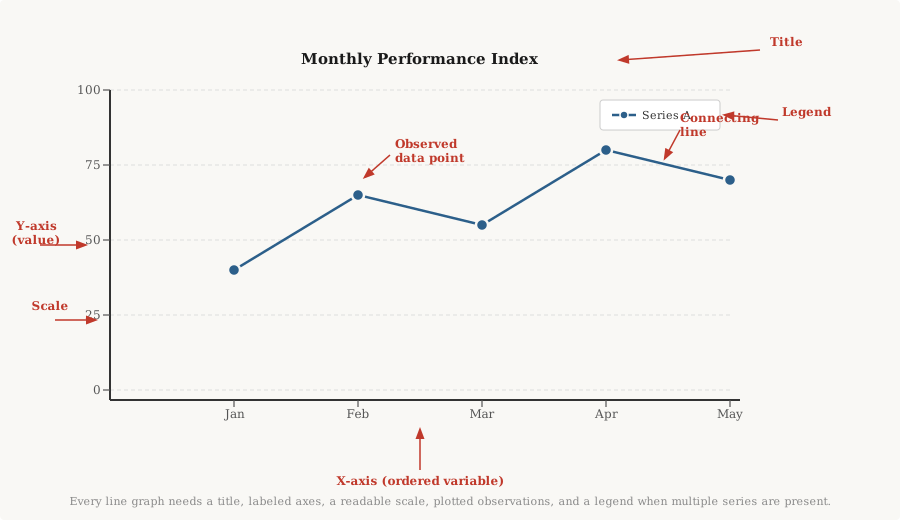
A line graph has a title, an x-axis (the ordered or time variable), a y-axis (the measured value), a numerical scale on the y-axis, plotted data points, connecting line segments, and a legend when multiple series are present.
What goes on the x-axis of a line graph?
The ordered variable — most commonly time (days, months, years) or another meaningful sequence such as distance or age. The x-axis determines the order of your observations.
What goes on the y-axis of a line graph?
The numerical measurement: revenue, temperature, website visits, test score or whatever value you're tracking. Always include units.
Does a line graph have to start at zero?
Not always. A line graph uses point position, not bar length, so a nonzero baseline can be appropriate when you want to reveal small variation. The scale must be clearly labeled and should not be used to make trivial changes look dramatic.
Should all data points always be connected?
Only when the ordering is meaningful. Monthly revenue points should be connected to show the trend. Countries listed alphabetically should not be connected — use a bar chart instead. Never connect points across a period where no data was recorded.
What is a double line graph?
A double line graph places two data series on the same chart, each measured across the same ordered x positions. Both series use the same scale, making direct comparison possible at each time point.
How many lines is too many?
There's no fixed rule, but more than three or four lines on one chart often becomes difficult to follow. If lines overlap frequently, consider small multiples or filtering to the most important series.
What do you do with missing data on a line graph?
Show a gap in the line for the missing period, or annotate it clearly. Never substitute zero for a missing value — zero means a measured zero, not an unknown one.
When should you use a scatter plot instead of a line graph?
When the question is about the relationship between two numeric variables rather than trend over time. Also when the numeric distance between x-values matters, since a standard line chart treats all x labels as equal steps.
Can a line graph show percentages?
Yes. Label the y-axis to show the unit — "Conversion rate (%)" — and always state the denominator: the total that the percentages are calculated from.
Can a line graph show negative values?
Yes. The y-axis extends below zero. Mark the zero line clearly when your data crosses it.
Can you forecast from a line graph?
A line graph describes the data it was built from. Extending the line beyond your last observation is not forecasting. Forecasting requires a stated method, documented assumptions and validation against independent data.
How do you make a line graph in Excel?
Put ordered labels in one column and values in the next. Select the range, go to Insert → Insert Line or Area Chart, and choose a 2-D line style. Add a chart title and axis labels. Check the y-axis bounds under Format Axis.
How do you make a line graph in Google Sheets?
Put labels in the first column and values in additional columns. Select the range, click Insert → Chart, choose Line chart, then use the Customize tab to add titles and set axis ranges.
What can AmriData's Line Graph Maker do?
It supports manual data entry, spreadsheet paste, CSV/TSV import, up to six series, up to 80 ordered positions, equal or actual-date horizontal spacing, point-marker customization, PNG export, SVG export and data CSV export. Chart data stays in your browser and is not uploaded to AmriData.
Key Takeaways
- A line graph shows how a measured value changes across a meaningful sequence — usually time. The order of observations drives the entire chart.
- The x-axis carries the ordered variable (time, position, sequence); the y-axis carries the measurement. Label both with units.
- Connect points in sequence only when that sequence is meaningful. Alphabetically ordered countries should not be connected with a line.
- The segment between two points is a visual connection, not a record of every intermediate value.
- Unlike bar charts, a line graph does not always need a zero baseline — but the displayed scale must be clearly labeled and honest.
- Horizontal spacing carries meaning. When elapsed intervals differ substantially, use actual date or numeric spacing, or clearly explain equal-position treatment.
- Missing does not mean zero. Show a gap rather than substituting a false zero.
- When numeric x-distance matters, use an XY scatter chart rather than a standard line chart that treats all x labels as equal steps.
- Two lines moving together do not prove causation. Extending the last segment forward is not forecasting.
- AmriData, Excel, Google Sheets or paper can all create line graphs. Software doesn't determine whether a chart is analytically correct — your data and labeling do.