
How to make a bar graph: write down your categories and their numerical values, choose vertical or horizontal bars, start the value scale at zero, draw bars of equal width and label both axes. Each bar's length must match its value. This guide shows the process by hand, online, in Excel and in Google Sheets.
Our worked example uses an invented survey of 20 students: 8 chose apples, 6 bananas, 4 oranges and 2 pears. The same numbers appear in the tables and diagrams so you can check each step. This tutorial belongs to the Data Visualization category.
For a quick result, open the free AmriData Bar Chart Maker. It supports manual entry, pasted spreadsheet values, CSV/TSV import, and PNG or SVG export.
How Do You Make a Bar Graph?
- Prepare a table of distinct categories and values.
- Choose horizontal or vertical orientation.
- Draw the category axis and a numerical value axis starting at zero.
- Use equal intervals and draw proportional, equal-width bars.
- Add the title, axis labels, units and any source or sample-size note.
What Is a Bar Graph?
A bar graph — also called a bar chart — is a way to compare separate categories using rectangular bars. The length or height of each bar represents a numerical value: more length means a bigger value. The terms "bar graph" and "bar chart" mean the same thing, and most people use them interchangeably.
Software packages sometimes split them: many programs label horizontal bars as "bar charts" and vertical bars as "column charts." That naming convention matters when you are working in Excel or Google Sheets, but it does not change what the chart actually shows.
When to Use a Bar Graph
Bar graphs work well when your data has distinct, named categories and you want to compare a numerical value across them. Common situations:
| Use a bar graph when… | Consider another chart when… |
|---|---|
| Categories are separate groups (fruits, products, departments) | Data is a continuous distribution → histogram |
| Goal is comparison or ranking | Main question is trend over continuous time → line graph |
| Each category has one numerical value | You need to show the spread within groups → box plot |
| You are showing counts, averages, totals or percentages | Part-of-a-whole with very few categories → pie chart |
For a deeper look at the full decision, see the guide on how to choose the right chart type.
How to Make a Bar Graph in 5 Steps
- Organize your categories and values.
- Choose horizontal or vertical orientation.
- Create the category axis and the value axis.
- Choose an appropriate numerical scale and draw the bars.
- Add a title, axis labels and units, then check your work.
Step 1 — Organize Your Categories and Values
A bar graph needs two things: a list of categories and one numerical value for each category. Put them in a two-column table before you draw anything.
Here is a simple example used throughout this guide. A class of 20 students was asked to pick their favorite fruit. The results:
| Fruit | Students |
|---|---|
| Apples | 8 |
| Bananas | 6 |
| Oranges | 4 |
| Pears | 2 |
| Total | 20 |
Check: 8 + 6 + 4 + 2 = 20. The totals match the survey count. Fruit names are categories — each one is a distinct, separate group — so a bar graph is the right choice.
Step 2 — Choose Horizontal or Vertical Bars
| Vertical bars | Horizontal bars |
|---|---|
| Labels are short (one word works) | Labels are long phrases or sentences |
| Few categories (two to eight) | Many categories (eight or more) |
| Familiar column-style display expected | Ranking from top to bottom is the main message |
For the fruit example, short labels and four categories make vertical bars a natural fit. Neither orientation is wrong — they show the same data.
Step 3 — Create the Axes
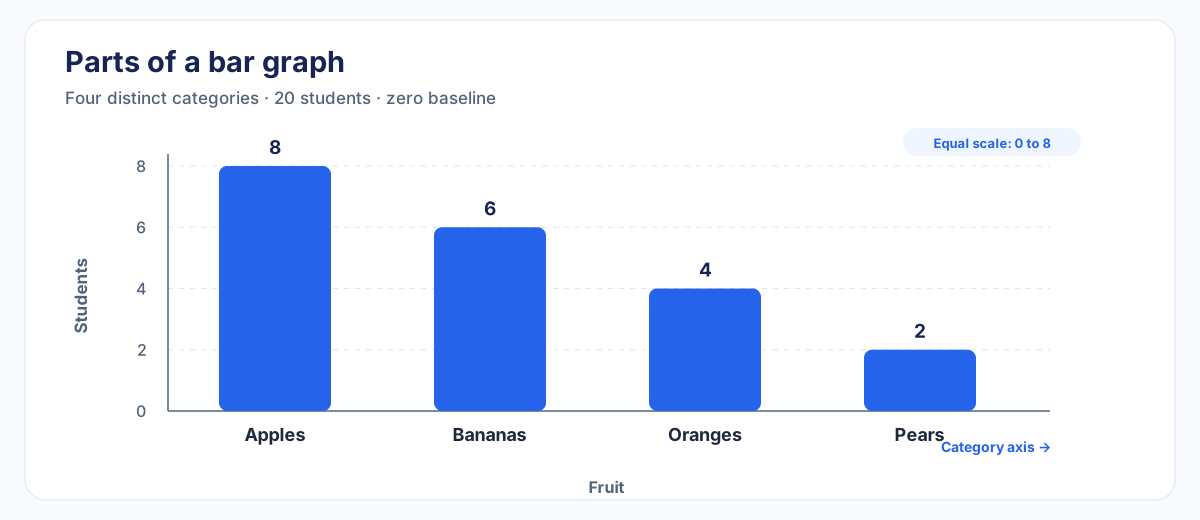
For a vertical bar graph, the horizontal axis lists the categories and the vertical axis carries the numerical scale. Swap those roles for a horizontal bar graph.
Label each axis so the reader knows what it measures. "Fruit" and "Students" are the labels for this example. If your values are in dollars, hours or percentages, say so on the axis.
Step 4 — Choose the Scale and Draw the Bars
The value scale should:
- Start at zero for ordinary bar-length comparisons
- Reach at least the largest value (8 students here)
- Use equal numerical intervals — for example, 0, 2, 4, 6, 8
- Be easy to read at a glance
Draw one bar for each category. Every bar gets the same width, starts from the same zero baseline, and its length matches the category's value exactly. Apples gets 8 units, Bananas gets 6, Oranges 4, Pears 2.
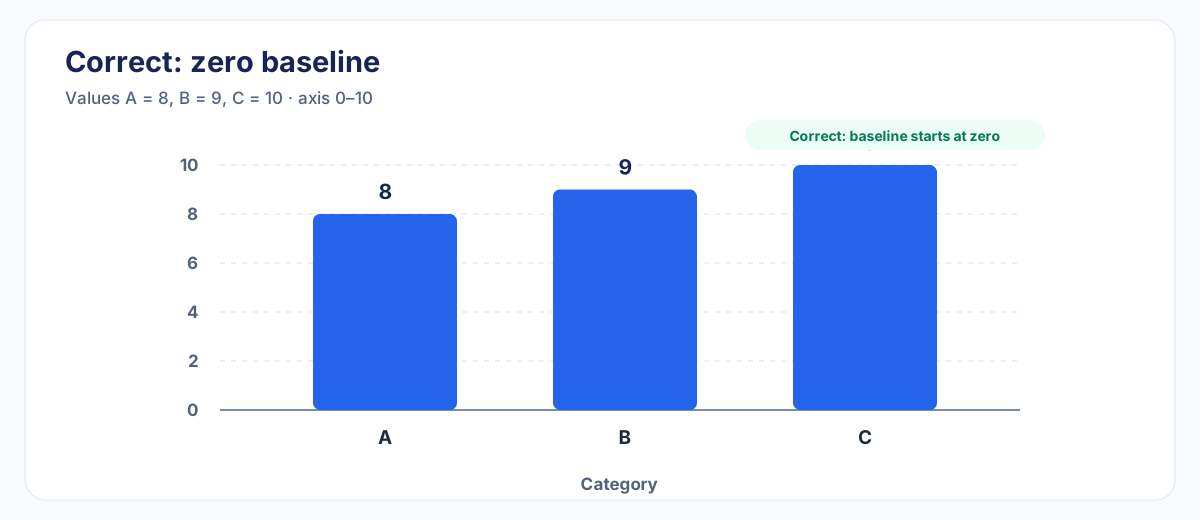
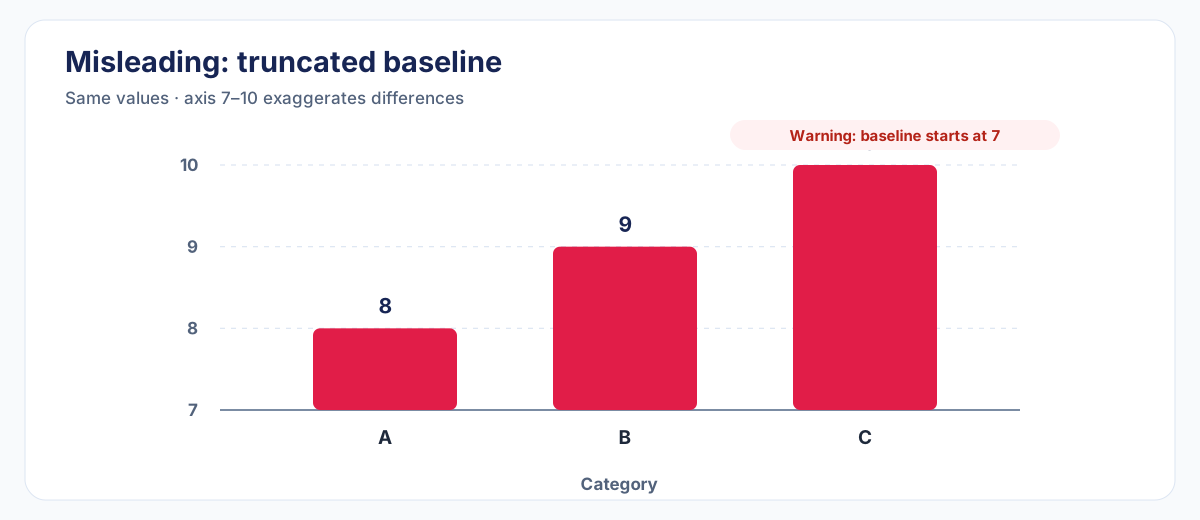
Why start at zero? Bar length represents magnitude. If the axis starts at 3 instead of 0, a bar of height 8 and a bar of height 4 look very different from their true ratio. A truncated baseline exaggerates small differences.
Step 5 — Add Title, Labels and Check Your Work
A good title tells readers what the chart shows. Compare:
- Weak: Bar Graph
- Better: Favorite Fruit Among 20 Students
Before you call it done, run through this checklist:
- Do bar heights match the data values?
- Does the value axis start at zero?
- Are scale intervals equal?
- Do all bars have the same width?
- Are the category axis and value axis labeled?
- Are units shown (count, %, $, etc.)?
- Does the title describe what the chart shows?
Complete Worked Example
Here is the fruit survey turned into a finished bar graph, using all five steps:
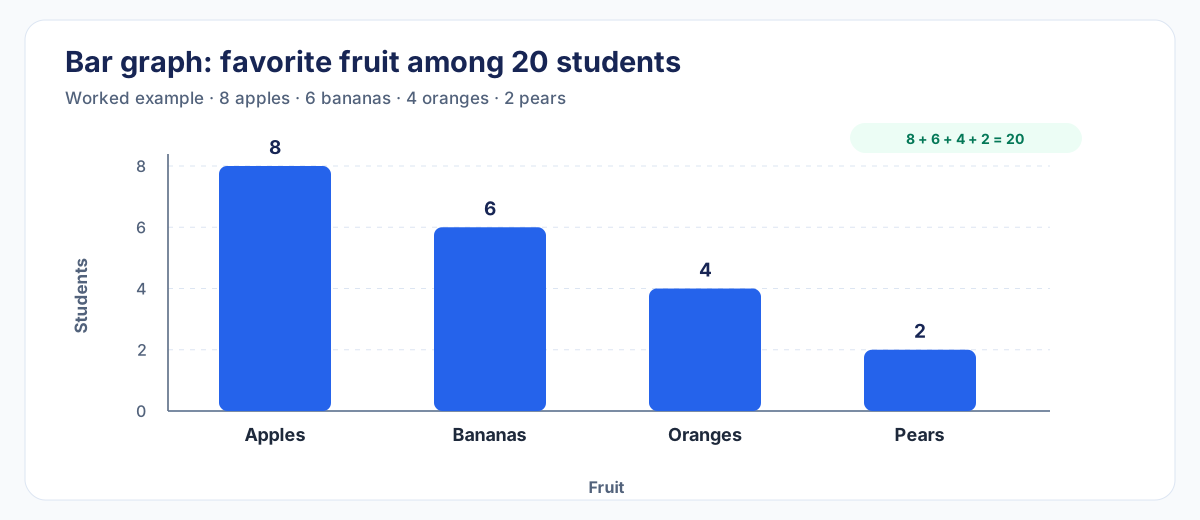
Apples received the most responses, with 8 students, while Pears received the fewest, with 2. Apples beat Pears by 6 students (8 − 2 = 6). The chart shows counts — it does not explain why students preferred one fruit over another.
How to Make a Bar Graph Online With AmriData
The AmriData Bar Chart Maker handles the axis setup, scaling and export so you can focus on the data. Its current interface supports manual data entry, spreadsheet paste, CSV/TSV upload, vertical charts, horizontal charts, grouped bars, stacked bars, 100% stacked bars, PNG export and SVG export.
- Open the Bar Chart Maker at amridata.com/tools/bar-chart-maker.
- Enter your data. Type category names and values directly, paste a two-column table from a spreadsheet, or upload a CSV/TSV file.
- Review the imported data to confirm values match your source.
- Choose the chart type: vertical (column), horizontal bar, grouped, stacked, or 100% stacked.
- Add a title and axis labels. The tool will not invent them for you — your labels need to describe your data.
- Check the preview. Confirm bar heights, scale intervals and that the value axis starts at zero.
- Export as PNG or SVG. PNG works for documents and slides. SVG stays sharp at any size.
If your data is already in Excel or Google Sheets, copy the two-column table and paste it directly into the Bar Chart Maker rather than retyping.
How to Make a Bar Graph by Hand
Drawing on paper forces you to think through every decision consciously, which is a useful exercise even if you normally use software.
- Get graph paper if available. Consistent spacing makes accurate scaling much easier, though it is not a strict requirement.
- Draw two perpendicular axes. Label the horizontal axis with your category names and the vertical axis with your numerical measure.
- Mark the scale. Decide your interval (2 students per tick in the fruit example), draw tick marks at equal spacing, and label them. Confirm the scale reaches your largest value.
- Draw equal-width bars from the zero baseline. Use a ruler. Each bar's top should land precisely on its value.
- Write the chart title above or below the graph.
- Add units on the value axis (e.g., "Students" or "Revenue ($)").
- Check against the data table: bar height, equal widths, zero baseline, correct labels, category spelling.
How to Make a Bar Graph in Excel
Before you start: in Excel, "Bar" usually means horizontal bars and "Column" usually means vertical bars. Many people searching for "bar graph in Excel" want one or the other — both options live in the same menu. This guide uses current Excel ribbon labels; verify against your version.
- Put your data in a table. Category labels go in one column, numerical values in the adjacent column. Include a header row.
- Select the data range, including headers.
- Open the Insert tab on the ribbon.
- Click Insert Column or Bar Chart in the Charts group. Choose a 2-D Clustered Column for vertical bars or 2-D Clustered Bar for horizontal bars. Avoid 3-D options.
- Add a chart title. Click the default title placeholder and type your own.
- Label the axes. Use Chart Elements (the + button) to show axis titles, then type your labels.
- Check the value axis. Right-click it → Format Axis and confirm the minimum is set to 0.
- Sort categories if useful. For nominal data, sorting largest-to-smallest often makes ranking clear. Preserve original order for ordinal or time-based categories.
For broader Excel analytical work, the Excel data analysis guide covers PivotTables, formulas and more.
How to Make a Bar Graph in Google Sheets
Google Sheets uses the same terminology split as Excel: "Bar chart" is horizontal, "Column chart" is vertical. Both types are created through the same chart editor.
- Put categories in the first column and numerical values in the second column. Add header labels in row 1.
- Select the data range.
- Click Insert → Chart. The chart editor panel opens on the right.
- Under "Chart type," choose Bar chart for horizontal bars or Column chart for vertical bars.
- Open the Customize tab in the chart editor to add a chart title, axis titles and axis range.
- Set the numeric axis minimum to 0: use Customize → Vertical axis for a column chart, or Customize → Horizontal axis for a horizontal bar chart.
- Click outside the chart editor when done. Double-click the chart to reopen the editor.
Horizontal vs Vertical Bar Graphs
The same data looks fine in either orientation. Choose based on your labels and the number of categories.
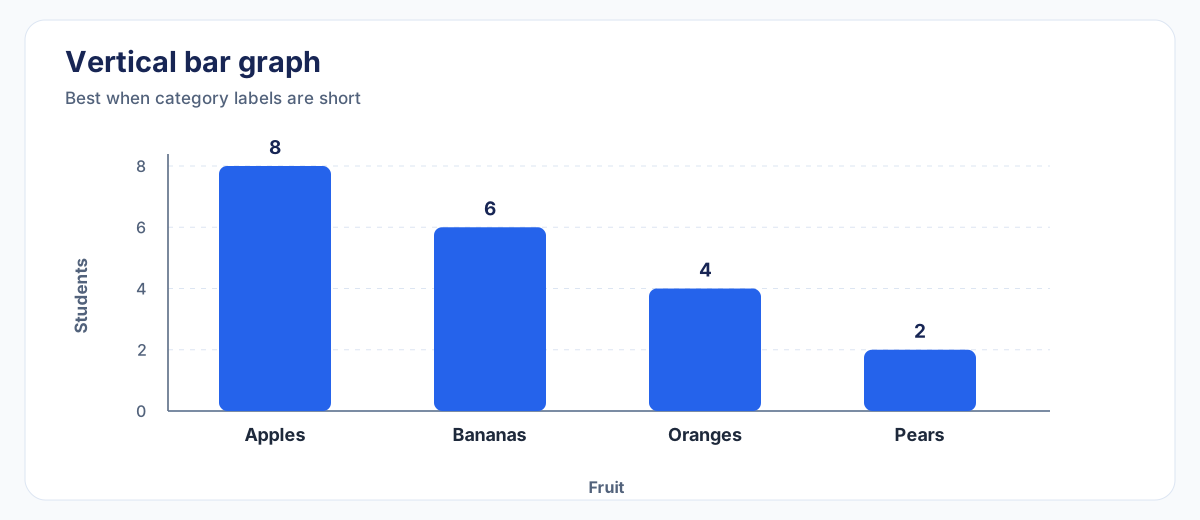
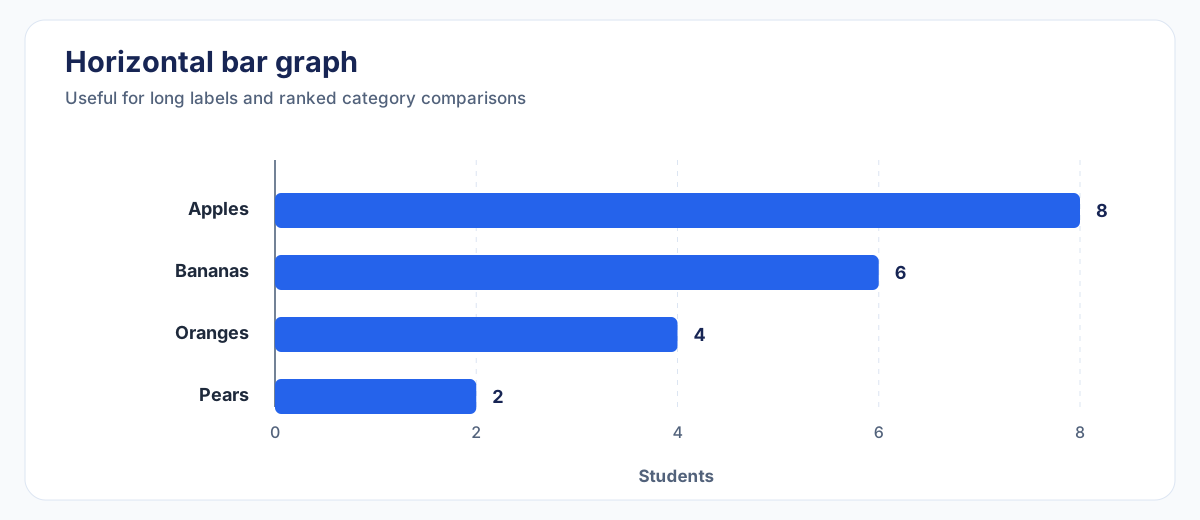
Software naming note: Excel and Google Sheets call the horizontal version a "Bar chart" and the vertical version a "Column chart." The Bar Chart Maker (vertical column option) handles vertical categorical displays.
Grouped and Double Bar Graphs
A grouped bar graph places multiple series side by side within each category so you can compare them directly. A double bar graph is a grouped chart with exactly two series — nothing structurally different, just two bars per category.
Here is a regional sales example with two years of data:
| Region | 2025 | 2026 |
|---|---|---|
| North | 80 | 95 |
| South | 70 | 88 |
| West | 90 | 92 |
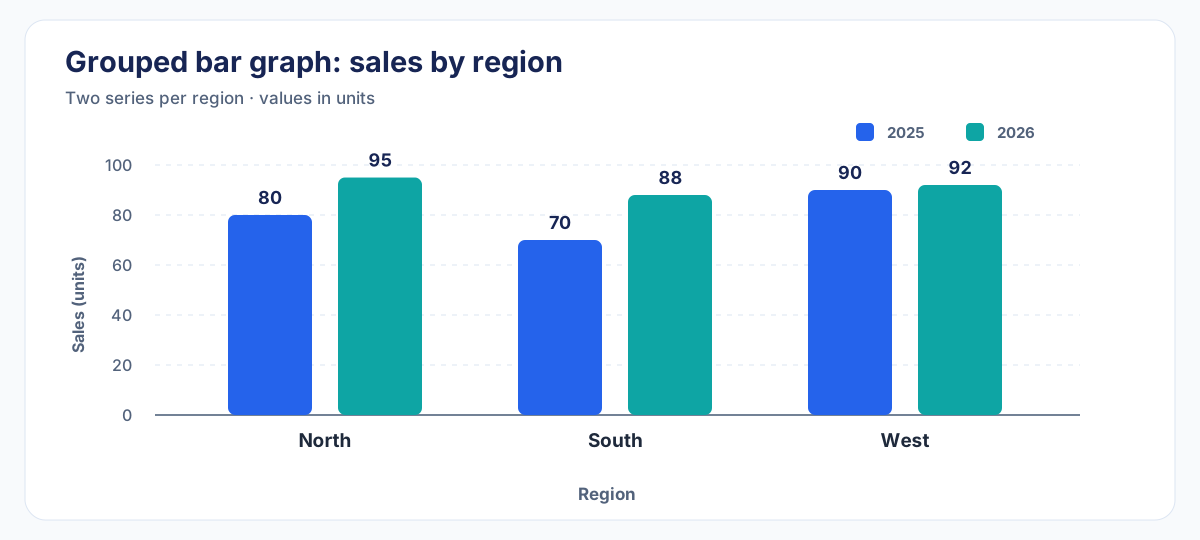
Use grouped bars when you want side-by-side comparison within each category. Keep the number of series small — more than three or four bars per category usually creates clutter that is hard to decode.
Stacked Bar Graphs
A stacked bar graph piles series on top of each other rather than placing them side by side. This shows both the category total and how the components add up to it. Use it when you care about both pieces of information at the same time.
The main limitation: segments that do not share a common baseline are harder to compare precisely. If exact comparison between series matters, a grouped layout is clearer.
A 100% stacked bar rescales every category so it totals 100%, making proportions the focus. It hides absolute totals completely — if North has 10 tickets and South has 10,000, their bars look identical.
Bar Graphs With Percentages
You can show percentages on a bar graph instead of raw counts, as long as you state the denominator — the "percentage of what" — clearly.
| Fruit | Students | Percentage |
|---|---|---|
| Apples | 8 | 40% |
| Bananas | 6 | 30% |
| Oranges | 4 | 20% |
| Pears | 2 | 10% |
| Total | 20 | 100% |
Check: 40 + 30 + 20 + 10 = 100%. Label the value axis "Students (%)" and include a note that percentages reflect 20 students surveyed. Both raw counts and percentages are valid — choose whichever answers your question.
Bar Graph vs Histogram
These two charts look similar but represent different things:
| Bar graph | Histogram | |
|---|---|---|
| Data type | Separate, named categories | Continuous numerical values grouped into intervals |
| Example | Fruit names: Apples, Bananas… | Test scores: 60–69, 70–79, 80–89… |
| Axis | Category labels on one axis | Numerical range bins on one axis |
| Bar gaps | Usually separated (distinct groups) | Usually touching (continuous range) |
| Question answered | How do separate groups compare? | How are individual measurements distributed? |
The gap between bars is a useful visual cue, but it is not the definition. What matters is what the bars represent. For a thorough comparison, see the histogram vs bar graph guide. To build a histogram, use the Histogram Maker.
Scale, Order and Labels
Sorting bars
For nominal categories — where the order has no fixed meaning — sorting from largest to smallest value makes ranking obvious at a glance. But some orders should be left alone:
- Ordinal categories (Poor → Fair → Good → Excellent) have a natural order tied to their meaning.
- Time categories (Jan, Feb, Mar…) run chronologically. Sorting months by value would answer "which month was best" but destroy the time pattern.
Color
A single-series bar graph works fine with one consistent fill. Save different colors for different series in grouped charts, where they carry real meaning. Do not assign a unique color to every bar in a simple chart — it adds visual noise without adding information. Never rely on color alone to identify categories; use labels too.
Gridlines and data labels
Light gridlines help readers estimate values. Data labels (numbers printed on bars) add precision when exact values matter. Avoid showing both dense gridlines and data labels at the same time — that doubles the information without improving clarity.
What to avoid
Skip 3-D bar effects. Perspective distorts apparent bar length and makes accurate comparison harder without adding useful information.
Common Bar Graph Mistakes
For a full treatment of visual errors across all chart types, see the guide on data visualization mistakes. These are the ones most specific to bar graphs:
- Value axis does not start at zero. Bar length represents magnitude — a truncated axis exaggerates small differences.
- Unequal scale intervals. Spacing 0, 2, 4, 10 at equal visual distances distorts the chart.
- Inconsistent bar widths. Bars must be the same width; varying width implies a second variable that is not there.
- Missing axis labels or units. "120" means nothing without "Revenue ($000s)".
- Vague or missing title. "Bar Graph" tells the reader nothing. "Orders by Channel — Q3 2026" tells them everything.
- Using a histogram for categories. Fruit names are not bins — use a bar graph.
- Wrong category order. Sorting ordinal or time-based categories by value changes their meaning.
- Too many colors. A rainbow of bars without a reason creates visual noise, not insight.
- 3-D perspective effects. They distort bar length and make comparison harder.
- Too many grouped series. Eight bars per category is unreadable; consider small multiples or a different layout.
- Comparing raw counts from unequal groups. If North has 100 customers and South has 10,000, a complaint count comparison needs rates, not totals.
- Inferring causation from bar height. A taller bar shows a larger value — not why it is larger.
Practice Examples
Practice 1 — Books read this month
Ali read 4 books, Sara read 7, Mina read 5, Omar read 3. Draw a bar graph. Check: scale reaches 7, all bars start at zero, axis labeled "Books read."
Practice 2 — Channel orders (horizontal)
Organic: 125, Paid Search: 94, Email: 72, Referral: 51. Try a horizontal bar graph — labels are longer. Sort largest to smallest. Label the axis "Orders."
Practice 3 — Percentage bar graph
In a survey of 40 people: 20 preferred Option A, 12 preferred B, 8 preferred C. Convert to percentages (50%, 30%, 20%), draw the graph and label the axis "Respondents (%)." State "n = 40" in the title or a note.
Practice 4 — Grouped bar graph
Department A: Q1 = 30, Q2 = 45. Department B: Q1 = 50, Q2 = 38. Draw a grouped bar graph with two bars per department. Add a legend identifying Q1 and Q2.
Frequently Asked Questions
What is a bar graph?
A bar graph compares numerical values across separate, named categories using rectangular bars. The bar length represents the value for that category.
Is a bar graph the same as a bar chart?
Yes. The two terms describe the same type of chart. Software may use "bar" specifically for horizontal bars and "column" for vertical bars, but "bar graph" and "bar chart" are generally interchangeable in everyday use.
What goes on the x-axis and y-axis of a bar graph?
For a vertical bar graph: category labels on the horizontal (x) axis, numerical values on the vertical (y) axis. For a horizontal bar graph, those roles swap.
Does a bar graph have to start at zero?
For ordinary bar-length comparisons, yes. Bar length represents magnitude, so a truncated baseline exaggerates small differences. Non-zero baselines can be acceptable in specialized contexts, but zero is the correct default.
Should bar graphs have gaps between bars?
Typically yes, to visually separate distinct categories. Histograms often omit gaps because their bins represent a continuous range. But the presence or absence of a gap is not the sole or best definition of either chart type — what matters is what the bars represent.
What is a double bar graph?
A double bar graph is a grouped bar chart with two series — two bars per category, displayed side by side. It compares two datasets within each category.
What is the difference between a bar graph and a histogram?
A bar graph compares separate named categories. A histogram shows how continuous numerical observations are distributed across value intervals. Fruit names → bar graph. Test scores grouped into 60–69, 70–79… → histogram. See the histogram vs bar graph guide for detail.
Can a bar graph show percentages?
Yes. Label the value axis to show the unit (e.g., "Respondents (%)") and always state the denominator — the total the percentages are calculated from.
Can a bar graph show negative values?
Yes. The value axis simply crosses zero, and bars below the baseline represent negative values. This is common in profit/loss and temperature charts.
How do I make a bar graph in Excel?
Select your data, go to Insert → Insert Column or Bar Chart, and pick 2-D Clustered Column (vertical) or 2-D Clustered Bar (horizontal). Then add a title, axis labels and confirm the value axis starts at zero.
How do I make a bar graph in Google Sheets?
Select your data, click Insert → Chart, choose Column chart or Bar chart in the chart editor, then add titles and confirm the axis minimum is 0 under Customize → Vertical/Horizontal axis.
When should I use horizontal bars instead of vertical?
Use horizontal bars when category labels are long, when there are many categories, or when ranking from top to bottom is the clearest way to present the data.
Should I sort the bars?
Sort nominal categories by value when ranking is the message. Keep ordinal categories (Poor → Excellent) in their natural order, and keep time categories (Jan → Dec) in chronological order.
Key Takeaways
- A bar graph compares separate named categories using bars whose lengths represent numerical values.
- The value axis should start at zero for ordinary magnitude comparisons, using equal intervals.
- Choose vertical bars for short labels and few categories; horizontal bars for long labels or rankings.
- Every chart needs a title, labeled axes and units — software will not add them for you.
- A grouped bar graph places multiple series side by side; a stacked bar graph shows component contributions; a 100% stacked bar shows proportions only.
- Bar graphs and histograms differ by what the bars represent — named categories vs numerical intervals, not just by gaps.
- The chart shows which category is larger — it does not automatically explain why.