
Statistical analysis is the process of using data, statistical summaries, and models to describe what has happened, estimate what may be true beyond the observations, or examine a specific question. A mean tells you the average in a dataset; a confidence interval addresses how precisely a population quantity has been estimated. Those are different jobs, and confusing them is where many analyses go wrong.
Consider two shops. One reports an average delivery time of eight days and the other ten. Is the second shop slower, or did you happen to measure an unusual handful of orders? Before reaching for a statistical test, you need to know how orders were sampled, whether the measurements are independent, what the distribution looks like, and how much difference would matter to customers.
This guide explains the types of statistical analysis, common techniques, worked calculations, test selection, software, and research reporting. It belongs to the Statistics category. If you need the broader workflow before choosing a statistical method, read what data analysis means and data analysis methods.
Descriptive vs. inferential Methods and formulas Worked examples Test selection Research and software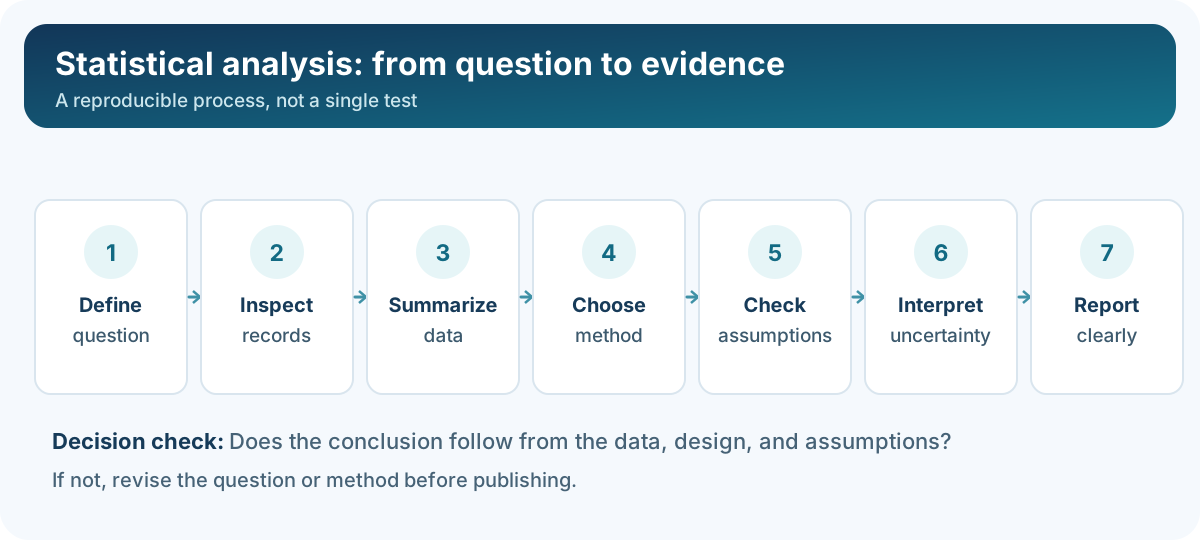
What Is Statistical Analysis? A Short Answer
Statistical analysis means organizing and examining data with numerical and graphical methods to answer a question. It includes simple descriptive measures, such as percentages and standard deviations, and inferential procedures, such as confidence intervals, hypothesis tests, and regression. The method depends on the outcome you measured, the sampling or study design, and the conclusion you want to draw.
| Question | Start with | What it can establish |
|---|---|---|
| What is the typical order value? | Median, mean and distribution | A description of recorded orders |
| How much do delivery times vary? | Standard deviation, quartiles, histogram | Variation within observed data |
| How precisely have we estimated a population average? | Confidence interval based on an appropriate design | An uncertainty range under stated assumptions |
| Do two independent groups have different means? | Welch's two-sample t-test, when appropriate | Evidence about a mean difference under a model |
| Are two categorical variables associated? | Contingency table; chi-square or an exact test | Association, not causation |
| How does an outcome change with a predictor? | Scatter plot, regression and diagnostics | Estimated association or prediction, not automatic causal effect |
Statistical Analysis Definition and Its Purpose
The definition covers more than pressing a button in statistical software. It begins with a question and a clearly defined population or set of records. You must decide what one observation represents, measure the relevant variables, account for data quality, and select a method whose assumptions are defensible. The output may be a descriptive summary, an estimate, a fitted model, or a test result.
The purpose of statistical analysis is to separate an observable pattern from the uncertainty around it. Sometimes you only need a trustworthy summary of every transaction in a month. At other times you have a sample of people and want to estimate something about a larger population. These situations should not be reported in the same way.
Statistics vs. data analysis: what is the difference?
Data analysis is the broader practice of preparing, exploring, interpreting, and communicating information. Statistics contributes established ways to measure variation, estimate quantities, and test claims. A dashboard showing last month's sales is data analysis. A carefully designed estimate of the population's mean spend, with sampling uncertainty, is statistical inference.
Why Is Statistical Analysis Important?
A single number can hide an inconvenient story. An average score may improve while a subgroup declines. A high correlation may be driven by one unusual observation. A marketing experiment may show an apparent lift too imprecise to act on. Statistical methods give you a disciplined way to inspect those possibilities rather than choosing the most encouraging number.
- Business decisions: compare conversion rates, customer segments, delivery times, or quality-control measurements.
- Research: estimate effects or associations, quantify uncertainty, and report enough detail for a study to be examined or repeated.
- Education: examine assessment results while accounting for differences among groups and the meaning of each measure.
- Operations: distinguish ordinary process variation from a change that deserves investigation.
Statistical methods cannot repair an unrepresentative sample, a poorly defined measurement, or a confounded study. They make the limits of the evidence clearer when applied properly.
What Are the Main Types of Statistical Analysis?
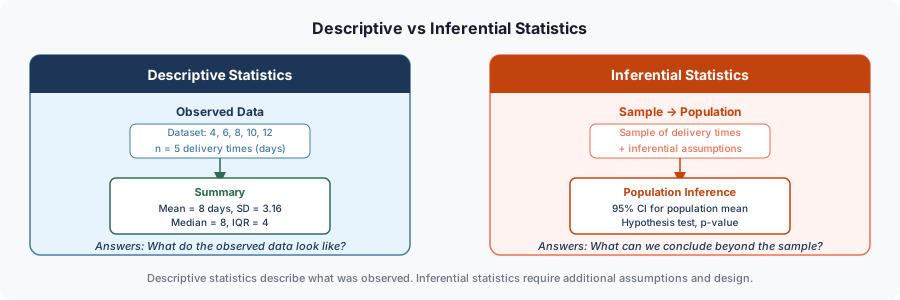
The broadest practical distinction is between descriptive and inferential analysis. Regression, ANOVA, correlation, chi-square tests, and clustering are not parallel top-level categories in that distinction. They are methods used for particular questions, sometimes descriptively and sometimes inferentially.
Descriptive statistical analysis
Descriptive statistics summarize the observed dataset. Typical measures include a mean, median, mode, frequency, percentage, standard deviation, interquartile range, and distribution plot. They can describe an entire population when all relevant records are available, or simply describe a sample without extrapolating beyond it.
If 120 of 600 recorded orders were returned, the observed return percentage is 20% (120 ÷ 600 × 100). That statement is about those 600 orders. It does not, by itself, establish what next month's return percentage will be.
Inferential statistical analysis
Inferential statistics use samples and an assumed data-generating or sampling model to draw conclusions about a broader group, unknown parameter, or process. Confidence intervals, hypothesis tests, and many model-based estimates belong here. Inference depends on the sampling method, independence or dependence between observations, model assumptions, and potential bias.
For instance, a random sample of customers might be used to estimate a population satisfaction percentage. A convenience sample of only the customers who answered an optional survey may have response bias; adding a 95% confidence interval does not remove that problem.
Where regression, correlation, ANOVA and clustering fit
Correlation describes an association between two measured variables. Regression models how a response relates to predictors and can support estimation or prediction. Analysis of variance (ANOVA) compares mean responses across groups in a specified model. Chi-square tests are commonly used with counts in categories. Cluster analysis groups records according to their similarities, generally as an exploratory, unsupervised method; it is not a hypothesis test by default.
Common Statistical Analysis Methods and Techniques
A useful method list starts with the question, not a software menu. These measures and procedures appear frequently in statistical data analysis, but they do different things.
Mean, median, mode and percentages
The mean is the sum of values divided by the number observed: mean = sum(x) / n. The median is the middle value after sorting, or the mean of the two middle values for an even count. The mode is the most frequent observed value, when one exists. For categorical data, a percentage is often more meaningful than a numerical average.
A shop with order values of $10, $12, $13, $15 and $50 has a mean of $20 but a median of $13. Both calculations are correct. The median better represents the middle order; the mean still matters when studying total revenue per order. Learn more in the mean, median and mode guide.
Variance, standard deviation and quartiles
The variance summarizes squared deviations from a mean. The sample variance divides the sum of squared deviations by n − 1; the sample standard deviation is its square root, returning to the measurement's original units. A population variance, where appropriate, divides by N. State which convention you use.
Quartiles and the interquartile range (Q3 − Q1) describe the middle portion of a distribution and can be useful with skewed observations. A box plot displays these summaries; a histogram shows how values are distributed across intervals. See also standard deviation explained.
Confidence intervals and margins of error
A confidence interval is an interval-producing procedure designed to contain the true population parameter at a specified long-run rate when its assumptions hold. A 95% confidence interval is not a statement that the fixed unknown parameter has a 95% probability of lying in one interval already calculated. The confidence level describes the procedure across repeated samples.
Margins of error often reflect sampling uncertainty; they do not automatically include nonresponse, measurement error, or a biased sample. A confidence interval for a population average is also different from a prediction interval for an individual future observation.
Hypothesis tests and p-values
A hypothesis test compares observed data with what a specified null model would make plausible. A p-value measures how incompatible the observed result, or a more extreme result under a specified test statistic, is with that model. It is not the probability that the null hypothesis is true, and a small p-value does not measure how important an effect is. Report the estimated effect, its uncertainty, and the study design alongside a test result. The American Statistical Association's guidance explains these distinctions.
Correlation analysis
Pearson's correlation coefficient r describes the direction and strength of a linear association between quantitative variables on a scale from −1 to +1. Spearman's rank correlation is useful for monotonic relationships measured by ranks or when a rank-based approach fits the data. Always inspect a scatter plot first: a few outliers, curved pattern, or separate subgroups can make a single correlation misleading.
How to Perform Statistical Analysis Step by Step
You do not need advanced software for the early steps. Most avoidable mistakes occur before a test is run.
- Write the decision question. Specify the outcome, population, comparison, time period, and what size of change would matter.
- Define the unit of observation. One row may represent a student, an order, a customer visit, or a weekly total. Repeated rows for the same person are not automatically independent.
- Check collection and sampling. Record how observations were obtained, whether groups were randomized, and which population the evidence can reasonably represent.
- Prepare and document the data. Inspect missing values, duplicate identifiers, inconsistent units, coding mistakes, and improbable measurements before deciding how to handle them.
- Explore with summaries and plots. Review counts, central tendency, variation, subgroup sizes, histograms, box plots, or scatter plots. Use exploratory data analysis to find distribution and quality problems.
- Choose the method. Match the outcome type, number of groups, paired or independent design, model goal, and sampling structure to a descriptive measure, test, or model.
- Check assumptions and robustness. Examine dependence, outliers, distributions, variance patterns, and whether a different justified choice changes the conclusion.
- Calculate and interpret. Report included sample size, effect or association, interval where relevant, statistical evidence, and meaningful limitations.
- Make the analysis reproducible. Keep the original data, cleaning decisions, calculations, software version, and an interpretable explanation of results.
For a data dictionary describing every field, try the Data Dictionary Generator. If you are preparing a spreadsheet, the guide to cleaning data in Excel covers common input problems.
Statistical Analysis Examples With Calculations
The following datasets are invented for learning. Their calculations can be reproduced, but their results say nothing about real stores, customers, or research populations.
Example 1: Calculate descriptive statistics
Suppose five delivery times, in days, are 4, 6, 8, 10 and 12. The mean is (4 + 6 + 8 + 10 + 12) / 5 = 8 days. The median is also eight days. Each value appears once, so there is no single mode.
| Delivery time | Deviation from 8 | Squared deviation |
|---|---|---|
| 4 | −4 | 16 |
| 6 | −2 | 4 |
| 8 | 0 | 0 |
| 10 | +2 | 4 |
| 12 | +4 | 16 |
| Total | 0 | 40 |
The sample variance is 40 / (5 − 1) = 10 days², and the sample standard deviation is √10 ≈ 3.16 days. If these five days were the entire defined population rather than a sample, the population standard deviation would be √(40 / 5) ≈ 2.83 days. Identical data; different defined purpose and denominator.
Example 2: Compare two independent group means
An analyst records delivery times for two fictional groups of eight orders each. The values below are separate orders, not before-and-after measurements from the same orders. In real work we would still need to check that selection and independence are credible.
| Order position | Group A (days) | Group B (days) |
|---|---|---|
| 1 | 6 | 8 |
| 2 | 8 | 9 |
| 3 | 9 | 11 |
| 4 | 7 | 10 |
| 5 | 10 | 10 |
| 6 | 8 | 9 |
| 7 | 9 | 12 |
| 8 | 7 | 11 |
Group A's mean is 8.0 days and Group B's is 10.0 days, so the observed difference (B − A) is 2.0 days. Both sample standard deviations are approximately 1.31 days. Under an independent-samples, approximately normal mean-comparison model, a two-sided Welch t-test gives t = 3.055, df = 14, and p ≈ 0.0086. The corresponding 95% confidence interval for B − A is approximately 0.60 to 3.40 days.
That result describes what this test returns if its model and sampling assumptions apply. The example data were invented, not randomly sampled from a real population, so the p-value is a mathematical illustration rather than empirical evidence that one real delivery process is slower. The interval is also not a claim about future individual orders. A test result does not fix biased sampling or establish causation.
Example 3: Fit a simple regression line
Imagine five weekly observations of advertising spend measured in units of $100: x = [1, 2, 3, 4, 5]. The recorded lead counts are y = [2, 4, 5, 4, 5]. Ordinary least squares gives the fitted line predicted leads = 2.2 + 0.6 × spend units.
| Statistic | Value | Meaning |
|---|---|---|
| Slope | 0.60 | Fitted increase of 0.60 leads for one more $100 of spend |
| Intercept | 2.20 | Fitted value when spend is zero; outside observed spend range |
| R² | 0.60 | 60% of this sample's variation in lead counts is accounted for by the fitted line |
| Prediction at $300 | 4.00 leads | 2.2 + 0.6 × 3; a fitted value, not a guarantee |
Here the calculation is slope = Σ[(x − x̄)(y − ȳ)] / Σ[(x − x̄)²] = 6 / 10 = 0.6. The intercept is 4 − 0.6 × 3 = 2.2. This tiny series illustrates the formula, not a reliable ad-spend strategy. Time trends, targeting changes, and other factors could explain the apparent relationship. A regression coefficient alone does not prove that more advertising caused more leads.
How to Choose the Right Statistical Test
Start by asking whether your outcome is numerical or categorical, whether observations are paired or independent, and whether you are comparing groups, checking association, or making predictions. Statistical tests have assumptions; this table is a starting map, not an automatic prescription.

| Data and question | Possible method | Check first |
|---|---|---|
| One numerical sample vs. a reference mean | One-sample t-test | Independent observations, distribution and outliers |
| Two independent groups, numerical outcome | Welch two-sample t-test | Independence, approximate model suitability and influential observations |
| Two matched measurements, numerical outcome | Paired t-test | Valid pairing and distribution of within-pair differences |
| Three or more independent groups, numerical outcome | One-way ANOVA or Welch ANOVA | Independence, residuals and variance structure |
| Two categorical variables | Chi-square test of independence | Independent counts and adequate expected cell frequencies |
| Small sparse 2 × 2 category table | Fisher's exact test | Sampling design and whether the exact procedure is appropriate |
| Association between two quantitative variables | Pearson correlation, Spearman rank correlation | Shape, outliers, dependence and what association means |
| Numerical outcome with one or more predictors | Linear regression | Functional form, residuals, dependence and leverage |
| Binary outcome with predictors | Logistic regression | Independence, adequate event counts and model specification |
| Repeated measures, clustered or time-dependent data | Design-specific mixed, repeated-measures or time-series methods | Within-unit dependence; ordinary independent-sample tests may be wrong |
A rank-based or permutation approach can sometimes be more suitable than a classical parametric test, but it also has assumptions. A Mann–Whitney test, for example, is not a universal drop-in replacement for a test of two means. When the stakes are high or the design is complex, review the approach with a qualified statistician.
Analysis of Variance (ANOVA): What It Tests
ANOVA stands for analysis of variance. Despite the name, a standard one-way ANOVA tests whether group population means are all equal by comparing between-group variation with within-group variation. Its F-statistic is a ratio of variance estimates. A larger F can indicate that differences among group means are difficult to explain through the modeled within-group variation alone.
Suppose a school compares mean test scores across three teaching approaches. A one-way ANOVA can test the overall equality of means, but it does not identify precisely which groups differ. Follow-up comparisons, confidence intervals, and appropriate multiple-comparison handling may be needed. Neither a significant F-test nor post-hoc comparisons establish cause unless the design supports a causal claim.
When should you use a t-test, ANOVA or chi-square?
Use a t-test for a suitably modeled comparison of one or two numerical means, with the appropriate paired or independent form. Use ANOVA for a numerical response compared across three or more groups or a more complex factor design. Use a chi-square test of independence for association between categorical variables represented as counts. If you are comparing two small groups' proportions, a two-proportion procedure or Fisher's exact test may be more appropriate than a routine large-sample chi-square approximation.
For technical detail on assumptions, see the NIST two-sample t-test guide, NIST ANOVA introduction, and Penn State's categorical association lesson.
Regression Analysis in Statistics
Regression describes or models the relationship between an outcome variable and one or more predictors. In ordinary simple linear regression the fitted relationship is ŷ = b₀ + b₁x, where b₀ is the intercept and b₁ is the slope. The slope tells you the fitted change in the outcome for a one-unit change in the predictor, under the model. Whether that change represents a causal effect depends on the study design and other assumptions.
Multiple regression can include several predictors. For a binary outcome such as purchase/no purchase, logistic regression is often a better model than ordinary linear regression. Examine residual behavior, influential points, the form of relationships, missing data, and evaluation outside the fitting sample before treating model output as reliable prediction.
What are t-statistics and F-statistics in regression?
In ordinary linear regression, a t-statistic often tests an individual coefficient against a reference value (commonly zero), taking its estimated standard error into account. An F-statistic can assess a joint restriction, including whether a set of model coefficients is zero under the specified model. Neither statistic measures forecast accuracy, economic importance, or causality. The model's assumptions and the data-collection process matter more than a dramatic-looking test result.
Statistical Analysis With Missing Data and Outliers
Blanks are not automatically zeros. Missing values can be completely at random, related to recorded variables, or related to unobserved values. Those mechanisms affect which methods are defensible. Dropping incomplete rows can reduce sample size and introduce bias, while simplistic mean imputation can understate variability. Depending on the context, complete-case analysis, multiple imputation, weighting, or a model that accommodates missingness may be considered. Report the amount and pattern of missing data and explain your choice.
Outliers deserve investigation, not automatic removal. A box plot may flag an unusually high payment that is a valid transaction. A histogram can reveal skewness, multimodality, or an unlikely recording value. Check source records, document any exclusions, and show whether conclusions depend heavily on a few observations. See histogram shapes and the Box Plot Maker.
Statistical Analysis in Research and Survey Studies
A statistical analysis plan should name the primary question, outcome, population, comparisons, sampling or randomization procedure, anticipated sample size, missing-data strategy, planned models, uncertainty measures, and any important subgroup analyses. Write it before inspecting the study's main results when possible. Changing the plan after seeing outcomes can make an apparently surprising finding less credible.
Survey work needs special care. A question like “What percentage of all customers would recommend us?” requires attention to the sampling frame, nonresponse, survey weights where appropriate, and how the question was asked. If responses are clustered within schools or stores, standard errors based on independent respondents may be too small. A count of responses is not automatically an effective sample size.
How to write statistical analysis in a research paper
In the methods section, explain how data were obtained, define the outcome and predictors, identify each statistical method, name the handling of missing and repeated observations, and state any pre-specified significance or multiplicity rules. In results, report denominators, summary estimates, effect sizes or coefficients, uncertainty intervals where relevant, and the exact or suitably rounded test statistics. Include plots when they reveal shape or dependence the table cannot show.
Instead of writing “the groups were significantly different,” give the actual difference, its unit, interval, and sampling context. Also report meaningful null or uncertain findings rather than publishing only tests that crossed a threshold. Statistical analysis should let another researcher understand what was done and where the conclusions may fail.
Statistical Analysis Software and Tools
No single program is best for every dataset. The practical considerations are reproducibility, the available statistical procedures, ability to inspect assumptions, staff skills, and data privacy. Software can calculate a test correctly and still be given the wrong study design.
| Tool | Useful for | What to consider |
|---|---|---|
| Excel | Descriptive measures, PivotTables, plots, some tests via formulas or add-ins | Transparent formulas, correct ranges, documented assumptions |
| R | Statistical models, analysis scripts, research reporting and graphics | Package choice, coding and reproducible environment |
| Python | Data preparation, SciPy and statsmodels tests, modeling and repeatable pipelines | Library conventions, validated scripts and diagnostics |
| IBM SPSS Statistics | Menu-based research and survey workflows | Licensing, syntax retention and correct procedure settings |
| SAS | Enterprise analytics, formal statistical procedures and governed workflows | Licensing, programming environment and implementation review |
| jamovi or JASP | Accessible desktop statistical analysis with graphical interfaces | Available models, version and exportable outputs |
| AmriData tools | Data profiling, charts and preliminary exploration | Do not assume every formal inferential method is available or validated |
Excel versus dedicated data analysis tools covers the tradeoffs. For more accessible first steps, see the AmriData data analysis feature and its collection of data tools. Check the specific capabilities of each product before choosing it for hypothesis testing.
How to Do Statistical Analysis in Excel
Keep one observational unit per row, give every column a clear header, and separate raw data from summaries. For values in B2:B6, Excel supports =AVERAGE(B2:B6), =MEDIAN(B2:B6) and =STDEV.S(B2:B6). If the observations are the complete population of interest, use STDEV.P instead of STDEV.S. For categories, count the relevant records before calculating a percentage.
Excel also offers charts and, in supported desktop environments, an Analysis ToolPak for some procedures. Before interpreting a result, verify that blanks, text, paired ranges, labels, and the chosen tails or variance assumption are handled correctly. The dedicated Excel data analysis guide explains the wider workflow.
Charts That Help Explain Statistical Results
Charts are part of analysis, not just decoration after a result is decided. A histogram shows the distribution of one numerical variable. A box plot compares spread and potential outliers. A scatter plot shows a relationship between two quantities; a bar chart compares categories; a line chart follows values over time.
| Question | Useful display | Watch for |
|---|---|---|
| Are durations skewed? | Histogram | Bin width and missing values |
| Do distributions differ by group? | Box plot | Small group sizes and hidden shape |
| How do two numeric variables relate? | Scatter plot | Nonlinearity and influential observations |
| How do categorical percentages compare? | Bar chart | Correct denominators and axis scaling |
| Is a measurement changing by week? | Line graph | Time spacing, seasonality and incomplete periods |
For choosing among these displays, see how to choose a chart type. Check common visualization mistakes before publishing a figure.
Common Statistical Analysis Mistakes
- Starting with a favorite test: choose based on outcome type, research question, dependence, and sampling design.
- Treating repeated records as independent people: clustered or paired records can require different uncertainty calculations.
- Confusing p-values with effect sizes: statistical evidence and practical impact answer different questions.
- Reading a confidence interval as a probability for the fixed parameter: its usual frequentist interpretation concerns the repeated-sampling procedure.
- Assuming a significant ANOVA names the differing groups: the omnibus test alone does not identify the pairwise differences.
- Concluding causation from correlation or regression: consider randomization, confounding, reverse causation, and time.
- Ignoring distributions: unusual points, skewness and nonlinearity can change both summaries and model conclusions.
- Discarding missing or unusual observations without a reason: record the decisions and compare sensitivity to alternatives.
- Running many tests and reporting only one: selection and multiple testing can produce misleading conclusions.
- Overclaiming from a convenience sample: a narrow or biased data source cannot be generalized just by adding an interval.
- Equating a model's fit with prediction quality: evaluate generalization on suitable held-out data.
Frequently Asked Questions About Statistical Analysis
What is statistical analysis in simple words?
It is the use of numbers, summaries, graphs, and statistical models to understand data and answer a clearly defined question. Some methods describe observed records; others estimate or test claims about a larger population.
What are the two main types of statistical analysis?
The broad distinction is descriptive and inferential statistics. Descriptive methods summarize the data you have; inferential methods estimate population quantities or assess hypotheses under a sampling or model framework.
What are five common statistical analyses?
Five familiar method families are descriptive summaries, t-tests, ANOVA, correlation, and regression. Chi-square analysis is another common family for categorical data. This is a practical example list, not an official exhaustive classification.
How do I know which statistical test to use?
Identify whether the outcome is numerical or categorical, whether measurements are paired or independent, how many groups are compared, and whether you need association, prediction, or a mean comparison. Then examine distribution, sample size, dependence, and the test's assumptions.
What does ANOVA stand for in statistics?
ANOVA means analysis of variance. A standard one-way ANOVA tests whether the modeled means across groups are all equal; it does not, on its own, tell you which specific pairs differ.
Should I use an ANOVA or a t-test?
For two independent numerical groups, a suitable two-sample t-test, often Welch's version, is a common starting option. For three or more groups, ANOVA or Welch ANOVA may be appropriate. Paired and repeated-measures designs require the corresponding methods.
What is the difference between statistical significance and practical significance?
A hypothesis test assesses data against a statistical model. Practical significance asks whether the size of an observed or estimated change matters in context. A tiny difference can yield a small p-value with sufficiently precise data, yet have little practical value.
Can I perform statistical analysis in Excel for free?
Basic summary formulas and some charts are available in spreadsheet software, including free alternatives. Excel itself is not universally free. Advanced statistical procedures may require its supported ToolPak, an add-in, or separate software; availability depends on the product and version.
Can statistical analysis prove cause and effect?
Not by itself. Strong causal claims require an appropriate design and defensible assumptions, often including random assignment or rigorous approaches to confounding. Association, even in a complex regression, is not automatic proof of causation.
How do you write statistical analysis in a research paper?
State the study design, variables, sample, missing-data rules, methods, and assumptions. Then report sample sizes, estimates, intervals, test results where useful, and limitations. Keep analyses reproducible and do not selectively omit inconvenient findings.
Key Takeaways
- Statistical analysis describes observations and, with defensible sampling and models, can support estimates or tests about a larger population.
- Descriptive and inferential analysis are broad categories; t-tests, ANOVA, regression, correlation, and chi-square are particular techniques.
- Choose methods using the variable type, study design, independence or pairing, and the question—not a keyword or software shortcut.
- Report effect sizes, uncertainty, and limitations. A small p-value alone does not prove importance or causation.
- Inspect and document missing data, outliers, assumptions, and reproducibility before publishing results.
For your next dataset, begin with a question and basic summaries. If inference is justified, select the relevant test and check its assumptions. Browse the Statistics category for individual techniques and worked chart guides.
Related Statistics, Data Analysis and Visualization Guides
← Back to the Statistics category
Sources and Worked-Example Methodology
The statistical explanations are supported by the educational and professional references below. The invented worked examples were calculated separately and are provided for instruction only; they are not empirical study findings. Statistical procedures and interpretation depend on the design and assumptions of the actual dataset.
- NIST/SEMATECH — What Is Exploratory Data Analysis?
- NIST/SEMATECH — Two-Sample t-Test for Equal Means
- NIST/SEMATECH — Analysis of Variance Models
- Penn State STAT 500 — Chi-Square Test for Independence
- American Statistical Association — Statement on Statistical Significance and P-Values
- American Statistical Association — Statistical Significance and Replicability
Calculation note: Example 1 uses five invented delivery times, their squared deviations summing to 40, and the sample standard deviation √10. Example 2 uses two independent eight-row toy samples, a two-sided Welch t-test, and a t-based 95% confidence interval for the mean difference. Example 3 fits ordinary least squares to five invented (x, y) pairs; its fitted slope is 0.6, intercept 2.2 and in-sample R² is 0.60. These numerical examples do not justify generalizing to any real population.