
Types of data analysis are different ways to answer questions with evidence. In business analytics, four types are often taught together: descriptive (what happened), diagnostic (why it may have happened), predictive (what could happen next), and prescriptive (what to do). Researchers also classify analysis as qualitative, quantitative, or mixed-methods. These are not competing lists: they describe different dimensions of the work.
Suppose a shop's weekly revenue falls from $10,000 to $8,000. A summary establishes the decline. Further investigation asks whether fewer people ordered or customers spent less per order. A forecast estimates what may come next. A decision analysis weighs possible responses. The methods overlap, but the questions—and the evidence needed to answer them—are different.
This guide explains the classifications, the methods used within them, and where each fits in research and everyday decisions. If the terminology is new, read what data analysis means first. This article belongs to the Data Analysis category.
4 main types Qualitative & quantitative Research methods Worked examples Choosing a method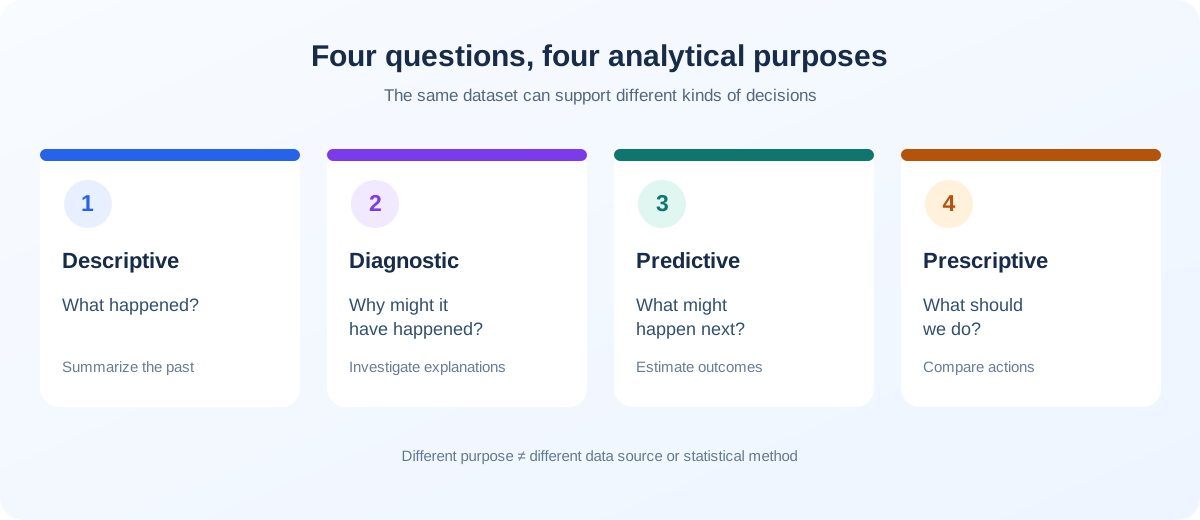
What Are the Types of Data Analysis?
There is no single universal number. Four types is the familiar business framework: descriptive, diagnostic, predictive, and prescriptive. Three research approaches are qualitative, quantitative, and mixed-methods. You will also encounter exploratory and inferential analysis, among other methods, which can be used inside these broader approaches.
| Classification | Common categories | What it tells you |
|---|---|---|
| By purpose | Descriptive, diagnostic, predictive, prescriptive | The question the analysis is meant to answer |
| By research approach | Qualitative, quantitative, mixed-methods | The kinds of evidence and interpretation used |
| By method or task | Exploratory, inferential, regression, thematic analysis, clustering, and others | How the evidence is inspected or analyzed |
That distinction matters. A regression model could be used to describe an existing relationship or to predict a future value. Interview coding could help diagnose a service problem. One technique can serve more than one analytical purpose; the label depends on the actual question and study design.
What Are the 4 Main Types of Data Analysis?
| Type | Main question | Typical output | Illustrative example |
|---|---|---|---|
| Descriptive | What happened? | Summary table, trend, dashboard | Revenue fell 20% this week |
| Diagnostic | Why might it have happened? | Breakdowns and investigated explanations | There were fewer orders, not smaller orders |
| Predictive | What may happen? | Forecast, probability, risk score | Estimated demand for next week |
| Prescriptive | What should we do? | Recommendation under stated goals and constraints | Choose a stock or marketing action to test |
1. Descriptive Data Analysis: What Happened?
Descriptive analysis organizes the observations you already have. You count purchases, calculate averages or medians, show the percentage of delayed deliveries, or draw a chart of revenue over time. The result may be simple, but definitions still matter. Revenue before refunds is not the same measure as net revenue; a count of order lines is not necessarily a count of distinct orders.
For example, a shop records 100 orders and $10,000 net revenue in one week, followed by 80 orders and $8,000 in the next. Revenue and order volume each fell 20%, while average order value stayed at $100. These are descriptive findings, not an explanation of what caused the change.
Useful techniques include frequency tables, proportions, measures of central tendency, variation and time-series charts. The guides to mean, median and mode and standard deviation explain two common building blocks.
2. Diagnostic Data Analysis: Why Did It Happen?
Diagnostic analysis investigates possible reasons behind an observed result. An analyst may split revenue by product, region, channel or customer cohort; inspect changes in price and volume; look for missing transactions; and compare the timing of operational events.
In the shop example, both weeks have a $100 average order value. That tells us the immediate arithmetic reason for the $2,000 revenue difference is 20 fewer orders, not a change in average spend. It does not tell us why those orders disappeared. Traffic, conversion rate, stock availability, tracking errors and seasonality are still possible explanations.
Important limitation: a breakdown can identify where a difference arose without proving that one factor caused it. Causal conclusions may require a sound experiment, a suitable quasi-experimental design, or stronger evidence than a simple before-and-after comparison.
3. Predictive Data Analysis: What Might Happen Next?
Predictive analysis estimates an unknown or future outcome using an explicitly defined model. Common tasks include sales forecasting, estimating the likelihood of customer churn, predicting delivery times, and classifying transactions for review. Regression, time-series models and machine-learning classifiers can all be used, depending on the problem.
If the shop simply assumes next week's order count will equal this week's 80, it gets an $8,000 revenue scenario at $100 per order. That is a naïve baseline, not a demonstrated reliable forecast. A defensible predictive analysis would use sufficient relevant history, compare the model against a baseline and measure its errors on data that were not used to fit it.
For time-based questions, evaluation should respect chronology: train on earlier periods and check later periods. A good fit to past data alone says little about future accuracy.
4. Prescriptive Data Analysis: What Should We Do?
Prescriptive analysis compares possible actions against an objective such as minimizing costs, improving service levels or maximizing expected profit. It may use forecasts, optimization, decision rules, simulation or scenario analysis. Constraints matter: a recommendation that assumes unlimited budget or unlimited inventory is of limited use.
For the shop, possible actions include fixing an out-of-stock product, changing a delivery offer, or testing a customer reminder. But the correct choice depends on evidence about the problem, expected impact, costs, margins and business priorities. An analyst should state the assumptions and trade-offs rather than label the most attractive-sounding suggestion as optimal.
The four labels describe questions, not an obligatory sequence. A team may need only a reliable descriptive report. Conversely, a useful prescribing decision may combine experimental evidence, a forecast and an optimization model.
Types of Data Analysis by Research Approach
Research classifications describe the form of evidence and the kind of reasoning used. They cut across the four business-analytics purposes. A study may collect both numerical measurements and interview material, even when its overarching question is diagnostic.
Qualitative Data Analysis
Qualitative data analysis examines meanings, experiences, language, interactions, documents or images. It is suitable when a simple count cannot capture the question. A researcher studying why people abandoned an online checkout might read interviews or open-ended feedback, compare accounts and develop an interpretation grounded in those responses.
Common types of qualitative data analysis include the following:
| Approach | Primary focus | Example |
|---|---|---|
| Thematic analysis | Patterns of shared meaning across material | How customers describe delivery uncertainty |
| Qualitative content analysis | Systematic examination and categorization of content | Categories in support messages |
| Narrative analysis | How experiences are told and structured as stories | Accounts of career changes over time |
| Discourse analysis | How language produces or negotiates meaning in context | How policy documents frame responsibility |
| Grounded theory | Iterative analysis aimed at developing an explanatory theory | How new employees adapt to informal rules |
| Phenomenological analysis | The nature or interpretation of lived experiences | How patients experience a prolonged wait |
These are not interchangeable software commands. Each approach has different assumptions about evidence and interpretation. For example, reflexive thematic analysis treats the researcher's interpretive involvement as part of the method; it should not be reduced to mechanical word-frequency counting.
Types of Coding in Qualitative Data Analysis
Coding means attaching meaningful labels to segments of source material so they can be compared and examined. Researchers may begin inductively, developing codes while reading the material, or deductively, using a prior theory or research question to guide coding. Some designs combine both. Descriptive codes identify a topic; interpretive codes attempt to capture a deeper meaning. In some grounded-theory traditions, initial, focused, axial or selective coding have method-specific roles.
| Response ID | Illustrative source excerpt | Provisional code |
|---|---|---|
| R01 | “The shipping fee only appeared at the end.” | Late fee disclosure |
| R02 | “My usual payment option wasn't offered.” | Payment availability |
| R03 | “I couldn't tell when the parcel would arrive.” | Delivery uncertainty |
These three responses are invented teaching examples, not participant quotations from a real study. The researcher would read complete responses, document how codes are defined, look for exceptions, and explain how any higher-level themes were developed. In a qualitative study, the number of comments alone does not establish how common a view is in the population. Suitable sample sizes depend on the question, sampling strategy, study aims and methodological tradition; there is no single sample-size rule for every qualitative approach.
Quantitative Data Analysis
Quantitative analysis works with numerical measurements or counts and applies mathematical or statistical reasoning. Examples include comparing average test scores, estimating a proportion with a confidence interval, testing a hypothesis, and modeling the association between advertising spend and sales.
One useful distinction is between descriptive statistics, which summarize the observed dataset, and inferential statistics, which use statistical assumptions and a study design to estimate or test claims beyond those observed values. Regression, ANOVA and other procedures may be used for description, inference or prediction depending on the objective.
Quantitative research is not automatically experimental. A survey may be quantitative and observational. Similarly, statistical significance does not automatically mean practical importance or establish causation. For a fuller treatment of assumptions and tests, see statistical analysis.
Mixed-Methods Data Analysis
Mixed-methods studies deliberately integrate qualitative and quantitative evidence. Imagine a school surveying 300 students about course satisfaction, then interviewing a selected group about confusing assignments. The survey describes score patterns; interviews explore what students mean by “unclear.” The research contribution comes from relating the two kinds of findings, not merely reporting separate tables and quotations.
Integration can occur when designing a study, selecting interview participants, analyzing the results or presenting a joint interpretation. Contradictions are informative. If survey ratings improve but interviews reveal new complaints, examine whether the questions, participants and time periods actually match.
Types of Data Analysis Methods and Techniques
Methods are the procedures used to examine evidence; types sometimes name the purpose of that work. The distinction is flexible in everyday speech. It helps, however, to separate “I want to know what happened” from “I will use a pivot table to calculate it.” The related article on data analysis methods goes deeper into method selection.
Exploratory Data Analysis (EDA)
EDA looks for structure and surprises before firm conclusions are drawn. You might inspect missing values, distributions, unusual observations and relationships between variables. Histograms, box plots, scatter plots, frequency tables and subgroup summaries are common tools. EDA can reveal a skewed distribution that makes an average misleading, or a subgroup that behaves differently from the total.
The exploratory data analysis steps guide explains a practical sequence. To inspect numeric distributions, try the Histogram Maker or Box Plot Maker. Exploratory patterns are questions to investigate; a pattern discovered after extensive searching should not be presented as though it were a pre-specified confirmatory test.
Inferential Data Analysis
Inferential analysis uses observations and statistical assumptions to estimate unknown characteristics or evaluate hypotheses. It includes confidence intervals, statistical tests and model-based estimation. The strength of the conclusion depends on sampling, dependence between observations, measurement quality and the validity of the model—not just a p-value.
For example, a difference in average scores between two classrooms could reflect teaching, pre-existing differences or chance. An appropriate comparison depends on how students were assigned and measured. Random assignment can support stronger causal inference than a purely observational comparison, but the details still matter.
Diagnostic and Explanatory Analysis
These methods use drill-downs, cross-tabulations, decomposition, comparisons and sometimes causal designs to investigate patterns. “Which group accounts for the change?” and “Did the intervention cause the change?” are different questions. The first may be answered by correct arithmetic; the second usually demands a stronger design and a careful assessment of alternative explanations.
Predictive Models and Prescriptive Techniques
Regression and forecasting models estimate outcomes; classification models estimate categories or probabilities. Cluster analysis instead groups observations according to selected similarities and is generally an unsupervised exploratory technique, not automatically a prediction. Optimization and simulation are often used when recommendations must respect costs, capacity and other constraints.
Methods can also be specialized by the dataset or purpose: spatial analysis examines geographic relationships; secondary data analysis reuses data collected for another purpose; survey analysis accounts for responses and, where applicable, sampling weights; and time-series analysis models data ordered through time. These are legitimate topics but do not need to be treated as extra entries in the four-type business framework.
Common Statistical Methods Used in Data Analysis
| Technique | When it is useful | Important check |
|---|---|---|
| Correlation | Describe the strength and direction of association | Shape, outliers, confounding; association is not causation |
| Linear regression | Model a numerical outcome using predictors | Functional form, residuals, dependence, validation |
| t-test | Compare means in an appropriate design | Independent versus paired samples and test assumptions |
| ANOVA | Compare means across groups under a suitable model | Study design, residual assumptions and follow-up comparisons |
| Chi-square test | Examine category counts or distributions | Expected counts and independent observations |
| Confidence interval | Express sampling or model-based uncertainty in an estimate | Sampling design and interval assumptions |
| Time-series methods | Study or forecast measurements through time | Trend, seasonality, leakage and chronological validation |
| Cluster analysis | Explore similarities and possible groups | Feature scaling, distance choice and cluster stability |
None is “best” without a question and a suitable dataset. A chi-square test for categorical counts and a regression model for a continuous outcome solve different problems. The Statistical Analysis guide provides the broader statistical framework rather than duplicating a full test tutorial here.
Types of Data Analysis in Research
In research methodology, the analytical approach should follow the research question, measurement, sampling plan and design. Calling a study quantitative or qualitative describes its evidence, but not necessarily whether the study is experimental, observational, cross-sectional or longitudinal.
| Study setting | Potential analysis | Question to settle first |
|---|---|---|
| Experimental research | Group comparisons, regression, effect estimation | Was assignment randomized and was the outcome pre-defined? |
| Survey research | Counts, weighted estimates, cross-tabs, intervals | Who was sampled and how were nonresponses handled? |
| Qualitative interviews | Thematic, narrative or other interpretive approach | What methodological perspective guides the interpretation? |
| Mixed-methods research | Statistical summaries integrated with coded accounts | Where and why will findings be integrated? |
| Educational research | Scores, repeated measures, interviews, observation | Are the same students measured repeatedly or nested in classes? |
| Psychology or clinical research | Modeling, appropriate tests, longitudinal and qualitative analysis | What do the ethics, measurement and design permit you to conclude? |
For example, comparing patient outcomes across two hospitals without accounting for differences in patient populations is not equivalent to a controlled experiment. Likewise, a small purposive interview sample can be useful for understanding experiences without being a population-prevalence survey. The methods should fit what the evidence can support.
Types of Data Used in Data Analysis
The type of data is different from the type of analysis. A nominal category such as delivery method, an ordered satisfaction rating, a numerical income measurement and a sequence of daily measurements do not necessarily call for the same calculation.
| Data form | Example | Typical starting point |
|---|---|---|
| Categorical / nominal | Payment method | Counts, percentages, bar chart |
| Ordinal | Five-level satisfaction response | Category proportions, medians when appropriate |
| Numerical | Delivery time in days | Distribution, median, spread, box plot |
| Time-ordered | Daily website visits | Line chart, seasonality and trend checks |
| Text / qualitative | Interview transcript | Contextual reading, coding and interpretation |
| Geographic | Store locations and catchment areas | Maps and spatial relationships |
Before selecting a technique, document what one row represents, the unit of measurement and the meaning of missing values. Use the Data Dictionary Generator to record field definitions and allowed values. The wrong unit of analysis can invalidate a technically correct calculation.
Types of Data Analysis Tools
Software categories are useful to distinguish from the methods themselves. A spreadsheet, statistical package and visualization tool may all calculate the same mean, while differing in reproducibility and handling of large datasets.
| Tool category | Good starting task | Consideration |
|---|---|---|
| Spreadsheets (Excel, Sheets) | Small-to-moderate tables, formulas, pivot tables | Audit formulas and source ranges |
| SQL / databases | Joining, filtering and aggregating structured records | Check join keys and duplicates |
| Python or R | Reproducible statistics, modeling and charts | Validate packages, scripts and assumptions |
| Qualitative analysis software | Organize and retrieve coded text | Interpretive judgment remains with researchers |
| Dashboards / BI software | Repeated monitoring and sharing of metrics | Define metrics and refresh rules |
| AI-assisted analysis | Draft formulas or code and explain checked output | Verify calculations, privacy and source coverage |
For spreadsheet practice, see data analysis in Excel and how to clean data in Excel. To learn dashboard design, use the data analysis dashboard guide. AmriData's data analysis feature and tools directory are other starting points; match the tool to your task rather than assuming software determines the statistical method.
Worked Example: One Dataset, Four Different Questions
Consider this invented two-week shop dataset. Each row summarizes a complete week of paid orders, with net revenue already calculated consistently. The numbers are intentionally small so you can check the arithmetic.
| Week | Orders | Net revenue | Average per order |
|---|---|---|---|
| Previous week | 100 | $10,000 | $100 |
| Current week | 80 | $8,000 | $100 |
- Descriptive question: What changed? Revenue fell by
($8,000 − $10,000) ÷ $10,000 = −20%. Orders also fell 20%, while average order value did not change. - Diagnostic question: Which observed component accounts for the drop? With revenue equal to orders multiplied by average order value in this example, lower order volume accounts for the $2,000 difference. The underlying reason for fewer orders is still unknown.
- Predictive question: What might happen next week? Carrying forward 80 orders at $100 each gives an $8,000 baseline scenario. Two weekly observations do not justify trusting it as an accurate forecast.
- Prescriptive question: What action is worth trying? Investigate traffic, conversion, stock and refunds first; then compare the cost and expected benefit of feasible actions. A small controlled test may be safer than changing prices based on two weeks of totals.
This example shows why a longer technical method is not always a better answer. A precise descriptive finding may be sufficient. Predictive and prescriptive conclusions require additional information that the table does not contain. No claim here is based on real AmriData users or sales records.
Examples of Different Types of Data Analysis by Industry
| Setting | Descriptive | Diagnostic / exploratory | Predictive / prescriptive |
|---|---|---|---|
| Marketing | Leads by channel | Investigate change in conversion rate | Forecast qualified leads; allocate spend under constraints |
| Sales | Revenue by month | Check lost deals and order composition | Forecast pipeline; prioritize follow-ups |
| Education | Score distribution | Explore misconceptions and feedback | Estimate support needs; evaluate interventions |
| Research | Summarize a sample | Explore themes and subgroup differences | Estimate outcomes where design permits; plan next study |
| Small business | Orders and margins | Investigate returns or slow periods | Forecast inventory; compare purchasing options |
These are examples of analytical questions, not claims that each industry needs advanced modeling. Often the hardest task is getting trustworthy definitions and comparable periods before selecting a method.
How to Choose the Right Type of Data Analysis
Begin with the decision you need to make. A question about a past count does not require a predictive model; a question about how people experience a service may require interviews rather than another numeric dashboard.
- Write the question in one sentence. For example, “Did the return percentage change after our policy update?”
- Specify the unit of analysis. Is one row a person, order, order line, survey response or date?
- Identify the evidence available. Are the records numeric, categorical, textual, geographical, time-ordered or a combination?
- Choose the purpose. Summarize what happened, investigate an explanation, estimate an unknown result, or evaluate possible actions.
- Check the research design. If you want inference or causation, establish sampling, independence, comparison groups and other assumptions before choosing a test.
- Select the smallest defensible method. Begin with a count, cross-tab, plot or relevant source excerpt; use complex models only when they answer a real need.
- Verify and communicate. Recalculate important results, preserve source evidence, show uncertainty where needed, and state what remains unknown.
Need a chart? A chart selection guide can help you match distributions, categories and time trends. For everyday comparisons, try the Bar Chart Maker or Line Graph Maker. A chart supports analysis; it is not a type of evidence by itself.
Common Mistakes When Classifying and Using Data Analysis
- Assuming there are only four methods: the four-type framework groups analytics by purpose, not by every procedure researchers use.
- Confusing qualitative with categorical: nominal survey categories are often analyzed quantitatively; open-ended accounts may be studied qualitatively.
- Using exploratory patterns as confirmation: checking dozens of relationships can produce apparently impressive coincidences.
- Treating correlation as causation: an association alone does not establish the mechanism behind it.
- Ignoring sample design: repeated observations, weighted surveys and clustered samples may need special handling.
- Using a model without evaluation: a close historical fit is not evidence of reliable out-of-sample predictions.
- Equating statistical significance with importance: consider effects, practical costs, uncertainty and context.
- Accepting an automated recommendation without constraints: the model may lack budget, capacity, privacy or operational information.
- Forgetting source definitions: missing records, duplicate keys and inconsistent units can overturn the conclusion.
Frequently Asked Questions About Types of Data Analysis
What are the 4 types of data analysis?
The commonly taught four types are descriptive, diagnostic, predictive and prescriptive analysis. They answer what happened, why it may have happened, what might happen and what action could be appropriate. They classify analytics by purpose rather than exhaustively listing research techniques.
What are the 5 main types of data analysis?
There is no universal five-type standard. Some teaching frameworks add exploratory analysis to the four business types. Others emphasize inferential analysis. State the classification being used instead of implying that every source agrees on one list of five.
What are the 3 types of data analysis?
In research, a common three-way distinction is qualitative, quantitative and mixed-methods. Other contexts may use a different three-part scheme. The answer depends on whether you are classifying evidence, purpose or procedure.
What are the 6 types of data analysis?
Some educational overviews discuss descriptive, exploratory, inferential, diagnostic, predictive and prescriptive analysis together. That is a useful teaching list but not a mutually exclusive or universally accepted taxonomy; exploratory and inferential work can contribute to several of the other purposes.
What types of data analysis are used in qualitative research?
Common approaches include thematic analysis, qualitative content analysis, narrative analysis, discourse analysis, grounded theory and phenomenological analysis. The appropriate choice depends on the question and methodological perspective. Coding is a process used in many approaches, not a separate universal research methodology.
What types of data analysis are used in quantitative research?
Descriptive and inferential statistics are central categories. Specific procedures include correlation, regression, t-tests, ANOVA, chi-square tests, time-series modeling and other methods chosen for the variable types and design. Predictive modeling is another possible goal of quantitative work.
Is exploratory data analysis one of the four main types?
Not in the common four-part business framework. EDA is an approach for examining data, identifying patterns, checking assumptions and deciding what to investigate further. It can support descriptive, diagnostic and predictive projects.
What is the difference between data analysis types and data analysis methods?
A type may describe the purpose or research approach; a method describes a concrete analytical procedure. Predictive is a purpose. Regression is a method that might be used predictively, descriptively or inferentially. The terms overlap in casual use, so explain which classification you mean.
Which type of data analysis is best for research?
Choose according to the research question, evidence, sampling strategy, design and assumptions. Open-ended questions about experience may call for qualitative analysis; numerical estimation may require quantitative methods; a question needing both can justify a mixed-methods design. There is no method that is best for all studies.
Which tools are best for data analysis?
For a small well-organized table, Excel or Sheets may be enough. SQL helps with structured datasets; Python and R support reproducible modeling; qualitative tools manage coded material; dashboards monitor defined metrics. Select the tool after defining the analytical task and checking your data-handling requirements.
Key Takeaways
- The four common business types are descriptive, diagnostic, predictive and prescriptive; they answer different decision questions.
- Qualitative, quantitative and mixed-methods classify research approaches, not rival versions of the same four-type list.
- Exploratory, inferential, regression, thematic analysis and clustering describe approaches or methods that may serve different purposes.
- Choose the method only after defining the question, evidence, unit of analysis, sampling or study design and required level of certainty.
- A correct number may still support the wrong explanation. Separate observed facts, causal claims, predictions and recommendations.
For a broader foundation, continue with What Is Data Analysis? or browse the Data Analysis category. If your next task is selecting a procedure, the separate Data Analysis Methods guide is the better next stop.
Related Data Analysis, Statistics and Visualization Guides
← Back to the Data Analysis category
Sources and Example Methodology
The four-purpose taxonomy, exploratory approach and qualitative-method distinctions were cross-checked against the resources below on October 20, 2026. The shop figures, student example and three coded checkout responses are constructed teaching examples, not empirical findings or real participant data.
- IBM — Prescriptive analytics and the four analytics purposes
- Intel — The four types of data analytics
- NIST/SEMATECH — What is exploratory data analysis?
- CDC — Collecting and analyzing qualitative data
- Braun and Clarke — Doing reflexive thematic analysis
Methodology note: the percentage change is (current − previous) ÷ previous × 100; the negative 20% result comes directly from the invented weekly totals. The $8,000 next-week value is explicitly a carry-forward scenario, not an evaluated forecast. This article describes analytic approaches; it does not replace research-design advice for consequential clinical, financial or policy decisions.